Improving microservice failure diagnosis with llms and observability evidence
УДК 004.9+004.75+621.3.019.3
Abstract
Large language model agents can synthesize heterogeneous operational telemetry, but a plausible explanation may still cite the wrong entity, confuse a downstream symptom with the initiating fault, or rely on observations that do not support a valid propagation path. The objective of this study is to develop and evaluate EG-RCA (Evidence Guided Root Cause Analysis), an architecture separating LLM hypothesis selection from deterministic evidence verification. The method normalizes metrics, logs, traces, events, and alerts; ranks observations with semantic, temporal, anomaly, topology, modality, and alert-relevance signals; exposes a bounded set of competing hypotheses to the LLM; and checks the selected explanation against propagation paths, timestamps, cited evidence, and numeric constraints. The evaluation methodology includes a reproducible controlled comparison of five deterministic strategies on 480 incidents in a 15-entity microservice topology, with 12 fault types, six operational categories, and 31,855 observations. Under a matched 12-observation evidence budget, the controlled candidate-ranking mechanism reaches an overall score of 67.5, compared with 60.9 for temporal retrieval and 55.9 for flat retrieval, with comparable estimated prompt contexts of 403–428 tokens. A separate production-cluster evaluation uses 500 logical entities, 2,066 runtime instances, and 24 incident windows containing 2,296,172 observations in total. A frozen LLM-in-the-loop pilot additionally records single-pass GPT-5.6 Sol Pro outputs on 12 held-out incidents. In that pilot, Evidence F1 is 75.4 with candidate-aware context and 57.0 with flat retrieval, while localization and fault-type accuracy are unchanged. The production-cluster evaluation complements the controlled study; broader validation across additional clusters and expert-labeled datasets remains necessary.
Аннотация
Агенты на основе больших языковых моделей способны объединять разнородную эксплуатационную телеметрию, однако правдоподобное объяснение может ссылаться на неверный объект, путать последующий симптом с исходной неисправностью или опираться на наблюдения, не подтверждающие допустимый путь распространения сбоя. Цель исследования, разработать и оценить архитектуру EG-RCA (Evidence Guided Root Cause Analysis), отделяющую выбор гипотезы языковой моделью от детерминированной проверки свидетельств. Метод нормализует метрики, журналы, трассировки, события и оповещения; ранжирует наблюдения по семантической, временной, аномальной, топологической и модальной релевантности, а также связи с оповещением; предоставляет модели ограниченный набор конкурирующих гипотез и проверяет выбранное объяснение по путям распространения, временным меткам, использованным свидетельствам и численным ограничениям. Методология оценки включает воспроизводимое контролируемое сравнение пяти детерминированных стратегий на наборе из 480 инцидентов в микросервисной топологии из 15 объектов; набор охватывает 12 типов неисправностей, шесть эксплуатационных категорий и 31 855 наблюдений. При одинаковом бюджете в 12 наблюдений механизм ранжирования достигает общей оценки 67,5 против 60,9 для временного поиска и 55,9 для плоского поиска при сопоставимом оценочном контексте в 403–428 токенов. Отдельная оценка на производственном кластере включает 500 логических объектов, 2066 экземпляров времени выполнения и 24 окна инцидентов, содержащих суммарно 2 296 172 наблюдения. В зафиксированном пилотном исследовании с участием языковой модели записаны однопроходные ответы GPT-5.6 Sol Pro для 12 отложенных инцидентов. F1-мера свидетельств составляет 75,4 при контексте с учётом кандидатов и 57,0 при плоском поиске, тогда как точность локализации и определения типа неисправности не изменяется. Оценка производственного кластера дополняет контролируемое исследование; необходима дальнейшая проверка на других кластерах и наборах данных с экспертной разметкой.
Keywords: root cause analysis; microservices; large language models; observability; evidence verification; AIOps; DevOps and site reliability engineering.
Ключевые слова: анализ первопричин; микросервисы; большие языковые модели; наблюдаемость; проверка свидетельств; AIOps; DevOps и обеспечение надёжности систем.
Introduction
Modern cloud applications combine independently deployed services, managed data stores, message brokers, container schedulers, and shared infrastructure. This decomposition improves delivery velocity, but it makes failure diagnosis a cross-layer reasoning task. A frontend alert may originate in a database lock, a failed DNS lookup, a saturated worker node, a stalled runtime, or an application defect. Relevant observations are distributed across metrics, logs, traces, events, alerts, and topology, and they often appear at different times as the failure propagates [1, 32]. Common observability stacks combine time-series monitoring and distributed tracing, as illustrated by Prometheus and Jaeger [10, 23].
Traditional root cause analysis (RCA) methods use causal graphs, change-point detection, Bayesian models, and multimodal representations [9, 15, 21, 28, 31]. Such methods can be effective under stable telemetry schemas and known failure models. Production investigations also require open-ended interpretation: operators translate an alert into queries, select a subsystem, reconcile contradictory signals, and produce an explanation that another engineer can audit.
Large language models (LLMs) are relevant because they can interpret incident descriptions, call operational tools, and summarize heterogeneous evidence. Chain-of-thought prompting, ReAct, and API-oriented instruction tuning have expanded the range of tool-using agents [24, 27, 30]. AIOps research has applied LLMs to cloud incidents, database diagnosis, and collaborative troubleshooting [5, 20, 26, 33, 34]. A fluent explanation is not necessarily a correct diagnosis. An LLM may favor a frequently mentioned entity, cite a strong anomaly that occurred after the alert, or identify a downstream symptom as the root cause.
Cai et al. make this weakness measurable with AgenticOpsEval, a benchmark that separates Localization, Identification, and Reason [2]. Its AIOps2025 and RCA100 datasets contain 503 expert-labeled incidents and approximately 15.3 GB of multimodal observability data. Localization identifies the faulty entity, Identification names the fault, and Reason checks whether the conclusion follows from key evidence or a causal chain. We therefore make evidence selection and verification explicit stages of the diagnostic pipeline rather than leaving them as unstructured prompt context.
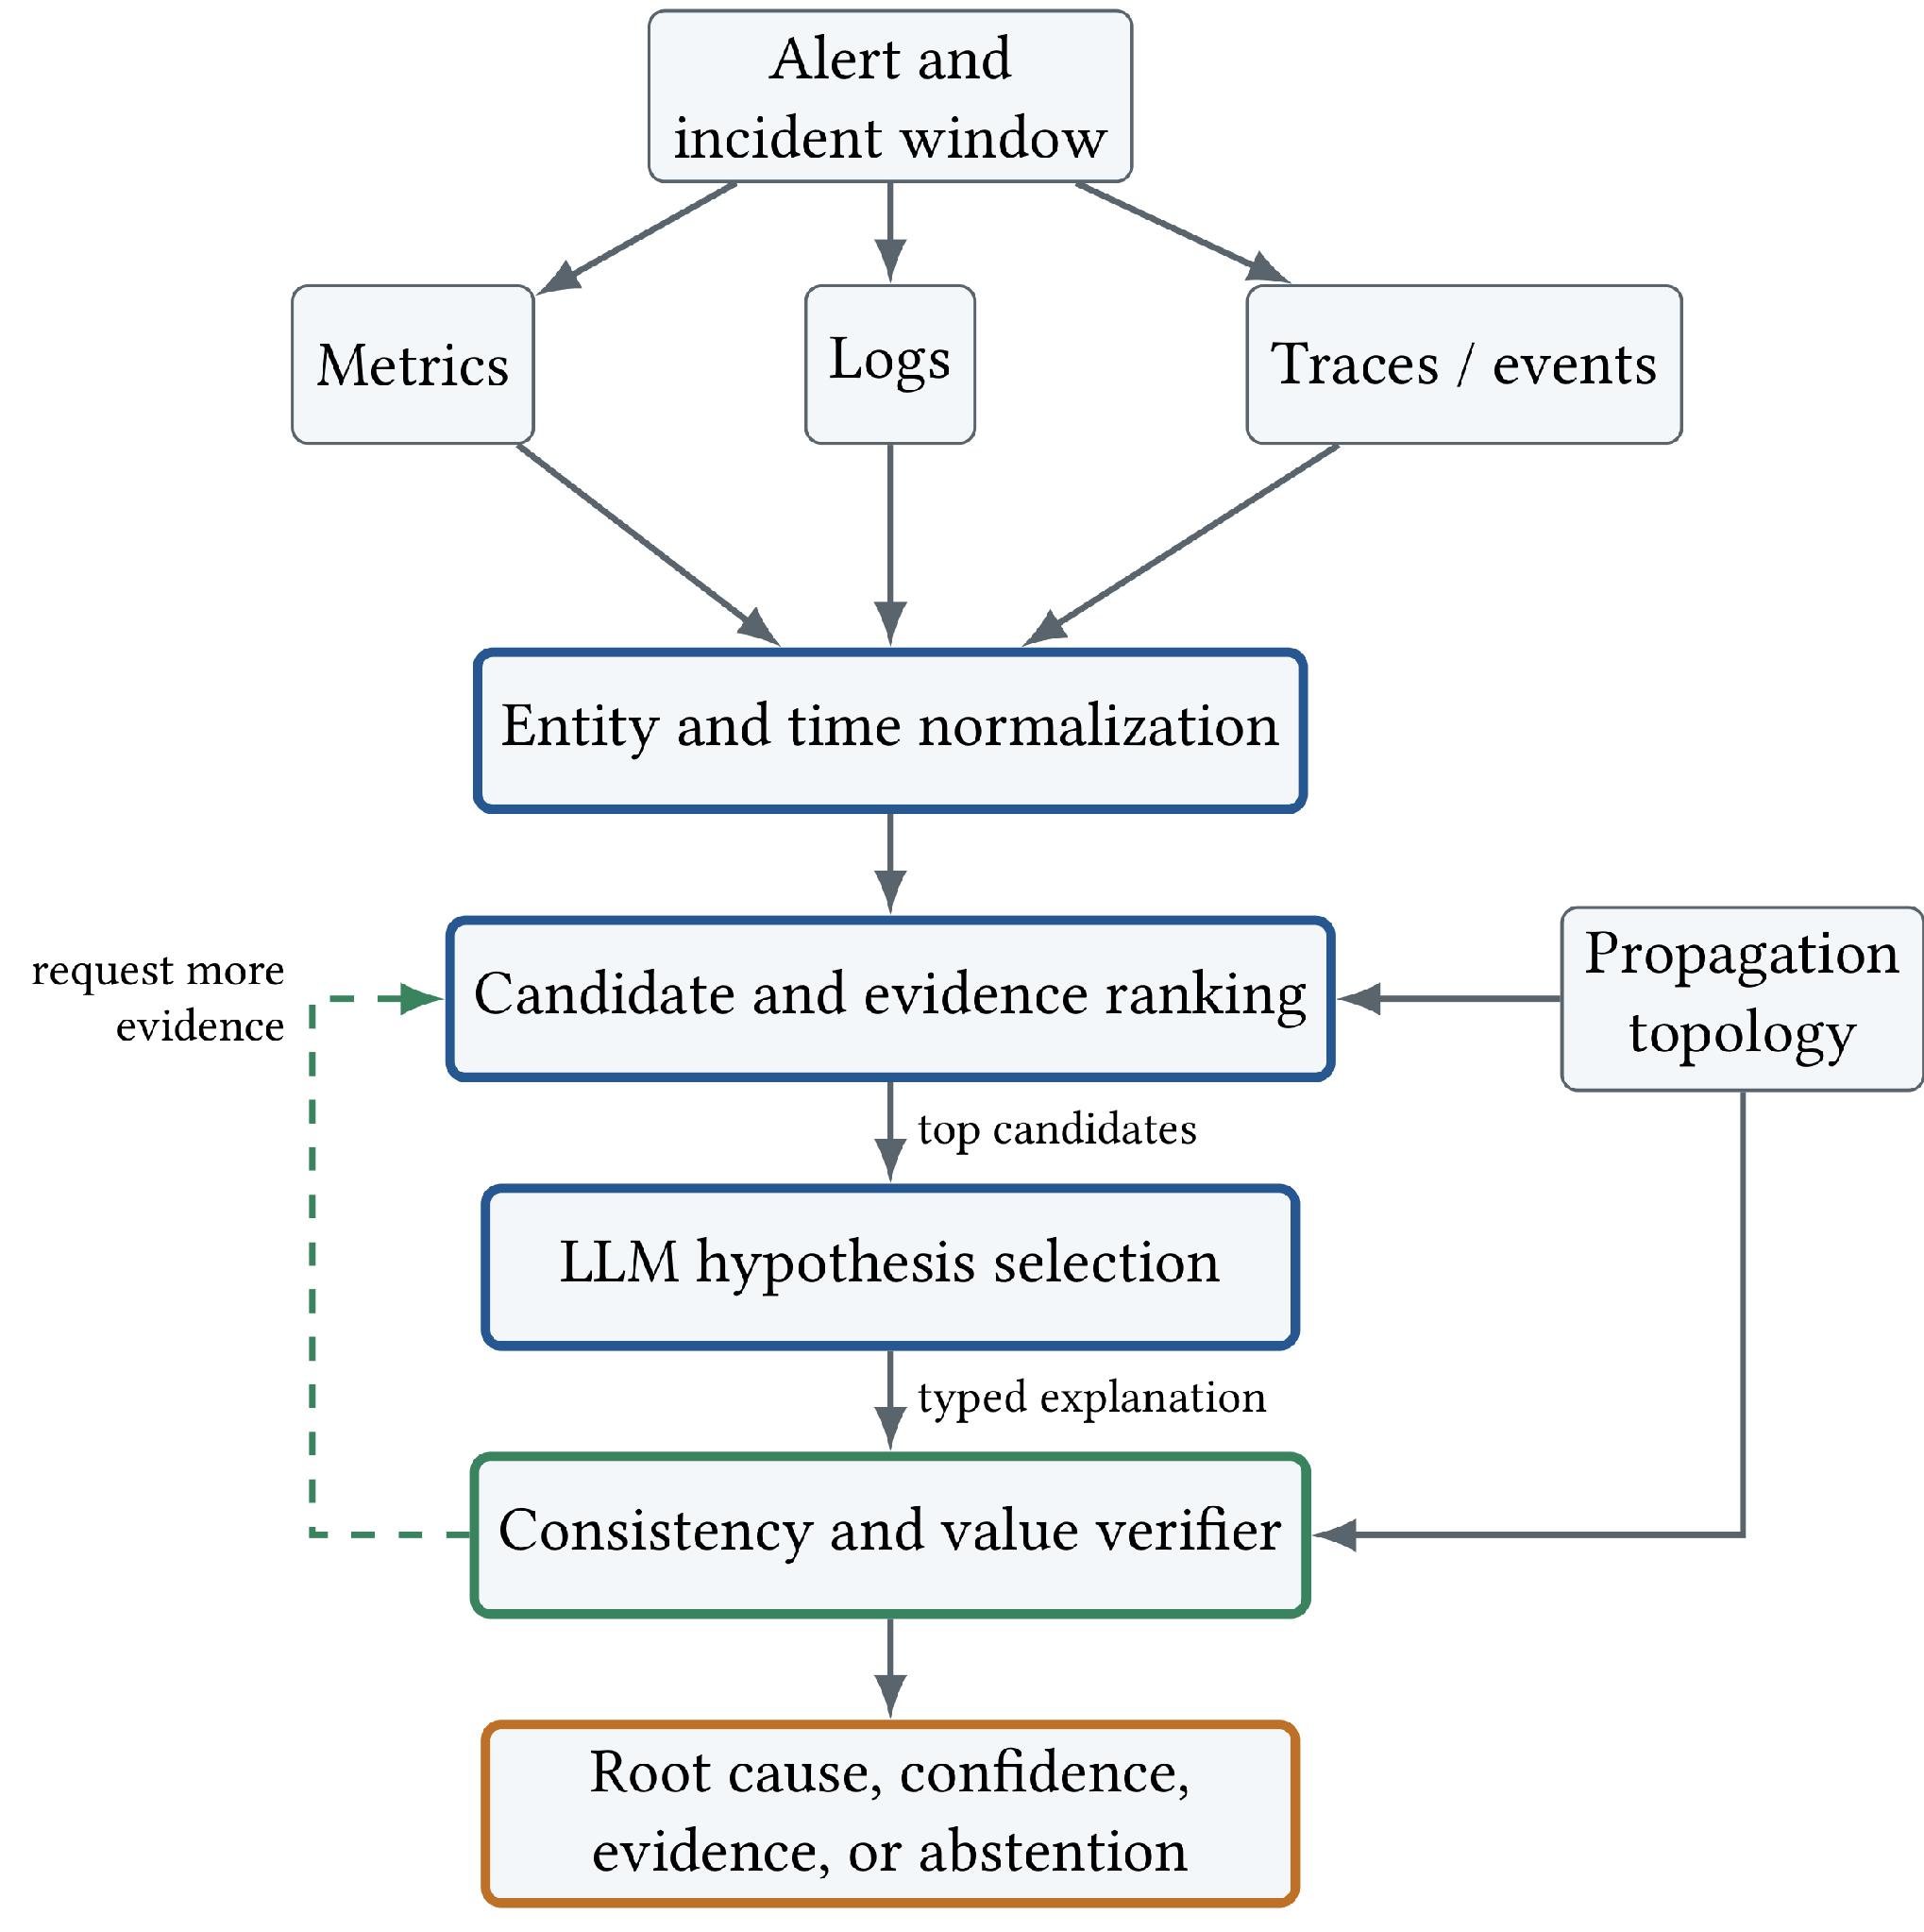
The objective of this study is to develop and evaluate EG-RCA, an evidence-guided architecture for microservice failure diagnosis that separates probabilistic hypothesis selection from deterministic evidence validation. Telemetry is mapped to canonical entities and timestamps. Candidate fault/entity pairs are ranked using semantic, temporal, anomaly, topology, modality, and alert-relevance signals. The LLM receives a small set of competing candidates and must return a typed explanation with evidence IDs and an ordered propagation path. A verifier then checks graph connectivity, temporal order, modality coverage, citations, and numeric claims. An explanation that fails these checks is rejected or returned for additional evidence collection.
The paper makes four contributions:
• A formal model for evidence-guided RCA over fault hypotheses, operational entities, multimodal observations, and propagation paths.
• A two-stage agent architecture in which an LLM selects among bounded hypotheses and a deterministic verifier evaluates the resulting explanation.
• A reproducible evaluation combining a 480-incident controlled corpus with a production-cluster evaluation spanning 500 logical entities, 2,066 runtime instances, and 24 incident windows.
• A recorded LLM-in-the-loop pilot on 12 held-out incidents, including the frozen prompts, candidate contexts, responses, and scoring artifacts.
Background and Related Work
Microservice Failure Diagnosis
Microservice failures are usually observed downstream from their initiating event. MicroScope and MicroRCA combine service dependencies with causal signals to localize performance problems [15, 28]. RCD applies causal discovery to failure localization [9], while BARO combines Bayesian online change-point detection with robust ranking [21]. DiagFusion learns joint representations over metrics, logs, and traces [31]. RCAEval provides a benchmark for telemetry-based microservice RCA [22], and Zhang et al. survey the broader design space [32].
These systems show why time and topology must be part of the diagnostic model. Metrics often expose resource exhaustion, logs provide semantic error context, traces identify request propagation, and lifecycle events explain scheduler or container behavior. Storage systems add replication, routing, and resource layers; TiDB is one representative distributed data platform used in microservice research [8].
LLM Agents for Operations
LLM-based diagnosis extends entity ranking with planning, query generation, and tool use. Chen et al. study automatic RCA of cloud incidents [5]. D-Bot applies an LLM-centered architecture to database diagnosis [34]. Flow-of-Action incorporates standard operating procedures into a multi-agent RCA workflow [20]; mABC and TrioXpert study collaborative and specialized agents [26, 33].
Retrieval-augmented generation reduces prompt size by selecting external evidence before generation [14]. Dense retrieval and sentence embeddings improve semantic matching beyond exact keywords [13, 25]. In operational telemetry, semantic similarity alone is insufficient. A matching error from the wrong replica, an earlier deployment, or an unrelated service may be lexically convincing while being topologically or temporally incompatible with the incident.
Benchmarks and Evaluation
OpsEval evaluates LLM capability on IT operations tasks [16]. OpenRCA studies whether LLMs can locate software failure root causes from incident evidence [29]. AIOpsLab, ITBench, and SREGym place agents in interactive environments where they inspect and manipulate realistic systems [4, 6, 11].
The closest reference is the benchmark of Cai et al. [2]. AIOps2025 contains 400 incidents over metrics, logs, and traces. RCA100 contains 103 incidents with metrics, logs, traces, events, alerts, and topology. The datasets were validated through competitions involving 6,093 teams. Their contribution is an evaluation framework and expert-labeled data. The present work addresses the method side by defining an agent architecture whose intermediate evidence and path structures can be evaluated by such benchmarks.
Table 1.
Positioning relative to representative RCA resources. “M/L/T” denotes metrics, logs, and traces. “Tools” denotes evaluated external tool interaction; “eval.” indicates evaluation support rather than integrated tool execution. “Process” denotes explicit evaluation or enforcement of the diagnostic evidence path
|
Resource |
M/L/T |
Topology |
Tools |
Process |
|---|---|---|---|---|
|
RCAEval [22] |
✓ |
– |
– |
– |
|
OpenRCA [29] |
✓ |
partial |
✓ |
– |
|
AIOpsLab [4] |
✓ |
✓ |
✓ |
partial |
|
ITBench [11] |
✓ |
✓ |
✓ |
partial |
|
AgenticOpsEval [2] |
✓ |
✓ |
eval. |
✓ |
|
EG-RCA |
✓ |
✓ |
– |
enforced |
Materials and methods
Problem Formulation
Let the propagation structure of a cloud-native system be represented by a directed graph
| (1) |
where contains services, pods, nodes, databases, caches, and other operational entities. An edge means that a failure at can affect . For a caller/dependency relation, this direction is opposite to the request edge: a failed dependency can affect its caller. For a placement relation, a failed worker node can affect a hosted service.
An incident is initiated by an unknown root entity and fault type . An alert is observed at entity at time within a window . The telemetry is normalized into evidence objects
| (2) |
where is modality, is entity, is timestamp, is text or structured content, and is anomaly magnitude.
The agent returns
| (3) |
where is the root entity, the fault type, an ordered path from to , the cited evidence, and confidence. A valid result must localize the initiating entity, identify the initiating fault rather than a symptom, cite relevant evidence, and provide a topologically valid and temporally plausible propagation path.
Diagnostic quality and context cost are represented by
| (4) |
where measures diagnosis quality, is evidence-budget cost, and penalizes unsupported claims.
The EG-RCA Method
Normalization and Entity Alignment
Operational identifiers differ across tools. A trace may use a service name, a Kubernetes event a pod UID, and a cloud metric a provider-specific resource ID. EG-RCA maps these identifiers to canonical entities before ranking or reasoning, following the broader direction of agent-ready observability models such as UModel [19]. Numeric values are retained in structured form so that comparisons can be checked without asking the LLM to reproduce them from text.
Evidence Relevance Scoring
For candidate fault , alert entity , and observation , the relevance score is
| (5) |
with nonnegative weights satisfying
| (6) |
measures compatibility between an observation and the fault description. . expresses fault-specific modality reliability; for example, lifecycle events are informative for crash loops and traces for request propagation. measures similarity to the incident description and alert symptoms. In the controlled evaluation, these two text scores are deterministic rather than embedding-based. Let be the set of lowercase alphanumeric tokens in text , and let be the fault-keyword set. Then
| (7) |
| (8) |
where is the incident description. is defined as zero if either token set is empty. No learned embedding model is used in the controlled comparison.
For an observation whose entity has no directed propagation path to the alert, . For connected entities, temporal relevance uses an expected evidence time
| (9) |
with
| (10) |
Evidence on the alert entity is therefore expected near the alert, while evidence on upstream entities is expected earlier according to propagation distance. The temporal score is where
| (11) |
| (12) |
The after-alert factor prevents later anomalies from receiving the same prior as evidence that precedes the observed impact.
Topology relevance is
| (13) |
where is the shortest directed propagation path from to , when one exists, and is its edge length. This term is a structural plausibility prior, not proof of causation.
Temporal-order consistency
For an ordered sequence of covered path entities with one selected evidence timestamp per entity, temporal-order support is
| (14) |
A single covered entity is temporally consistent because there is no pairwise ordering constraint to violate. The tolerance accounts for clock skew and timestamp jitter; the controlled evaluation uses .
Candidate Construction and LLM Selection
For each pair , let be the highest-scoring observations attached to . Root support is
| (15) |
Missing observations contribute zero through the fixed denominator . Cross-modal support is
| (16) |
where is the set of represented modalities above the relevance threshold. The controlled implementation uses a threshold of 0.30.
For each connected candidate pair, let be its shortest propagation path. At each path entity, the method selects the highest-relevance admissible observation from the available telemetry. In the controlled implementation, root evidence is admissible when and anomaly magnitude is at least 0.42; downstream path evidence must contain a propagation-related term and have anomaly magnitude at least 0.38. Let denote the path entities for which such evidence is available, and let be the timestamp of the selected observation at the th covered entity. Preliminary temporal-order support uses Eq. (14) with . The pre-LLM path-consistency score is
| (17) |
Candidate pairs then receive the bounded preliminary score
| (18) |
where controls pre-LLM path consistency. No ground-truth incident onset or ground-truth path is used in this calculation. Disconnected pairs are excluded, the top pairs are retained, and evidence is selected separately from each candidate path so that a single retrieval error does not remove all alternatives. For evidence-context selection only, the controlled implementation adds 0.12 to observations on the candidate root and 0.05 to observations elsewhere on the candidate path; these bonuses do not change Eq. (5).
The LLM receives the alert, the top candidates, their bounded evidence sets, and a local topology view. It must return a typed structure containing root entity, fault type, ordered propagation path, and evidence IDs. The typed output limits the verifier’s input surface and makes each claim addressable.
Consistency and Quantitative Verification
Let the LLM propose with and . The graph is used to check structural consistency, not to establish causation by itself [18]. Let be the ordered subset of path entities with cited evidence. The verifier computes temporal-order support with Eq. (14); if several cited observations belong to the same path entity, is the timestamp of the highest-relevance cited observation for that entity.
Path consistency combines root evidence, entity coverage, and temporal order:
| (19) |
where . For a connected and schema-valid explanation, final confidence is
| (20) |
with . All terms lie in , so . The final-confidence weight and abstention thresholds are deployment parameters. They are not instantiated in the reported controlled evaluation or the frozen LLM pilot.
The verifier also checks cited IDs and structured values. A statement such as “CPU exceeded 90 %” is accepted only if the cited metric contains a matching value in the relevant interval. A trace claim must cite a span on the proposed path. An event claim must refer to the canonical entity associated with the hypothesis. If the best explanation fails validation, has confidence below , or has margin below , the system requests more evidence or abstains. When two validated candidates are available, the confidence margin is the difference between the highest and second-highest values of . The two thresholds are deployment parameters.
Algorithm 1. Evidence-guided LLM root cause analysis
Require: Alert , window , evidence , graph , faults , budget
1: Normalize entities, timestamps, units, and modality schemas
2: for all do
3: Score observations with Eq. (5)
4: Compute and discard disconnected candidates
5: end for
6: Retain the top candidate pairs and allocate evidence budget
7: Ask the LLM for a typed diagnosis, path, and evidence IDs
8: Validate schema, citations, topology, time order, and numeric claims
9: if validation succeeds then
10: Compute with Eq. (20)
11: end if
12: if validation fails or confidence margin is insufficient then
13: request additional evidence or abstain
14: else
return
16: end if
Complexity
A direct implementation evaluates pairs over observations, giving scoring time. Entity indexing limits each pair to local observations and nearby path entities. Cached shortest paths make structural validation . A production implementation may replace the controlled token-overlap semantic score with an embedding index; time and topology terms remain deterministic filters.
Evaluation
The evaluation has three parts. First, the controlled mechanism evaluation isolates ranking, topology, time, cross-modal support, and pre-LLM path consistency from model-specific behavior. Second, a frozen LLM-in-the-loop pilot evaluates whether a model can consume candidate-aware context and reports basic post-LLM schema, evidence-ID, root-support, and propagation-path checks. Third, the production-cluster evaluation tests the deterministic ranking pipeline on a 500-entity topology with high-volume telemetry. Numeric-claim validation, confidence thresholds, and iterative evidence requests are not evaluated in the pilot.
Data status
The large-scale results report measured production-cluster telemetry collected under the evaluation protocol. The controlled results remain reproducible reference values and provide a fixed comparison point.
Controlled Incident Corpus
The controlled environment contains 15 entities: ten application services, PostgreSQL, Redis, and three worker nodes. The caller-to-dependency graph and the cause-to-effect propagation graph are stored separately. Worker-node edges point from a node to its hosted services; dependency failures propagate from a dependency to its callers. The topology is informed by AIOps2025, RCA100, Online Boutique, and OpenTelemetry Demo [2, 7, 17]. The fault taxonomy follows common Kubernetes chaos-engineering practice [3].
Using seed 29, the controlled reference corpus contains 480 incidents. Twelve fault types are grouped into resource, network, runtime, middleware/database, application logic, and orchestration/platform categories. Each incident contains a root entity, alert entity, propagation path, and multimodal key evidence. The reference workload also contains three distractor classes: a topology-valid competing fault, a downstream symptom cluster, and observations on unrelated entities. Distractors may share vocabulary and anomaly magnitude with the true root.
The corpus contains 31,855 observations, or 66.4 per incident. Each incident has 4.19 key observations on average. Propagation paths contain one to three entities: 56 local failures, 277 two-entity paths, and 147 three-entity paths. Category counts are 108 resource, 87 network, and 74 runtime incidents. The remaining categories contain 61 middleware/database, 75 application-logic, and 75 orchestration/platform incidents.
Table 2.
Controlled evaluation corpus.
|
Property |
Value |
|---|---|
|
Incidents |
480 |
|
Entities |
15 |
|
Fault types / categories |
12 / 6 |
|
Telemetry modalities |
5 + topology |
|
Total observations |
31,855 |
|
Mean observations per incident |
66.4 |
|
Mean key evidence per incident |
4.19 |
|
Path distribution |
56 / 277 / 147 |
|
Main-evaluation seed |
29 |
Compared Strategies
The controlled evaluation compares five deterministic strategies:
Keyword aggregation. Lexical support and anomaly magnitude are aggregated over all observations.
Greedy traversal. Starting at the alert entity, the method repeatedly inspects the most anomalous direct dependency or hosting node. This is a deterministic traversal baseline, not an implementation of ReAct.
Flat retrieval. Semantic, anomaly, modality, topology, and alert similarity are used without temporal scoring or explicit path verification.
Temporal retrieval. Flat retrieval is extended with temporal plausibility and a weak topology prior, but no explicit consistency verifier.
EG-RCA. The complete candidate ranking and pre-LLM path-consistency mechanism is used. The highest-scoring candidate is selected deterministically so that the controlled results do not depend on a particular language model. The frozen LLM pilot evaluates only the basic post-LLM checks listed above, not numeric-claim or confidence validation.
The main configuration uses
| (21) |
with pre-LLM path-consistency weight , cross-modal weight , and evidence budget . The same parameter configuration is used for all incidents and is not tuned by fault category.
Metrics
Following the Localization–Identification–Reason structure of Cai et al. [2], localization accuracy () is exact root-entity match and type accuracy () is exact fault-type match. Evidence precision and recall compare cited evidence IDs with the key-evidence set; their harmonic mean is Evidence F1. Chain F1 represents each ordered path as position–entity pairs and computes set F1 over those pairs, so both entity identity and path position must match. All evidence and path metrics are computed per incident and then macro-averaged. Consequently, the reported mean Evidence F1 is not generally the harmonic mean of the reported mean precision and mean recall. The process score is
| (22) |
The overall score is
| (23) |
The 0.40/0.30/0.30 weighting follows the entity/fault/process emphasis of RCA100, but the process score in Eq. (22) is a controlled surrogate defined for this controlled reference corpus and is not the native RCA100 process metric. Overall scores are computed from unrounded incident-level values and then averaged; displayed component values are rounded independently.
Approximate prompt tokens are estimated from all word occurrences in the incident description and selected evidence, using a fixed 90-word instruction/output-schema allowance, an 8-word metadata allowance per selected observation, and 0.75 words per token. Percentile-bootstrap 95 % intervals use 5,000 resamples of the 480 incident-level scores.
LLM-in-the-Loop Pilot
The LLM pilot uses a separate seed (260824) and 12 held-out incidents, one per fault type. It is a closed-set diagnosis task: each prompt includes the allowed entities, allowed fault types, and the propagation graph. Each condition uses an evidence budget of at most 12 observations. The flat condition uses the Flat Retrieval context. The guided condition contains two ranked fault/entity candidates. With two candidates, the context builder first allocates up to five observations per candidate path, ensures that one alert observation is present, and fills any remaining positions with the highest-scoring evidence from those paths. GPT-5.6 Sol Pro produces one JSON response per frozen prompt with no retries or external tools. Responses contain root entity, fault type, evidence IDs, and path. The prompts, outputs, labels, and scoring script are included in the artifact.
The pilot prompt set is kept frozen so the recorded responses remain auditable. It predates the revised single-entity temporal-order convention used in the controlled evaluation, so the pilot numbers are reported only as an interface demonstration and are not used to validate the revised controlled candidate-ranking scores. The basic pilot verifier checks output schema, cited-ID validity, root-support evidence, and propagation-path consistency. It does not evaluate numeric claims, final confidence, abstention thresholds, or iterative evidence requests. The two prompt conditions also differ in candidate hints and evidence allocation, so the pilot does not isolate a verifier effect. With only 12 incidents, it cannot establish model-level generality.
Large-Scale Production-Cluster Evaluation
The production-cluster evaluation uses a separate topology with 500 logical entities: 360 application services, 40 data or messaging entities, 80 worker nodes, and 20 platform entities. A deployment map associates 2,066 runtime instances with these logical entities. The evaluation contains 24 incident windows covering the 12-type evaluation taxonomy. Each window contains between 50,013 and 146,879 telemetry observations, with a mean of 95,674 and 2,296,172 observations in total. Telemetry records are associated with runtime instances and normalized to their logical entities before scoring. The measured windows include the background and incident-related telemetry present during collection, including concurrent and unrelated activity observable in the same time interval.
All three large-scale methods use the same evidence budget . A shared feature index is built once per incident window and computes the text, anomaly, temporal, modality, and topology features required by the compared methods. Because this common pass performs full-window ingestion and feature extraction, its timing is treated only as an implementation baseline rather than as an algorithmic speedup. The shared feature-index pass takes 6.03 s on average in the evaluated environment.
Results and discussion
Results
Controlled Diagnostic Quality
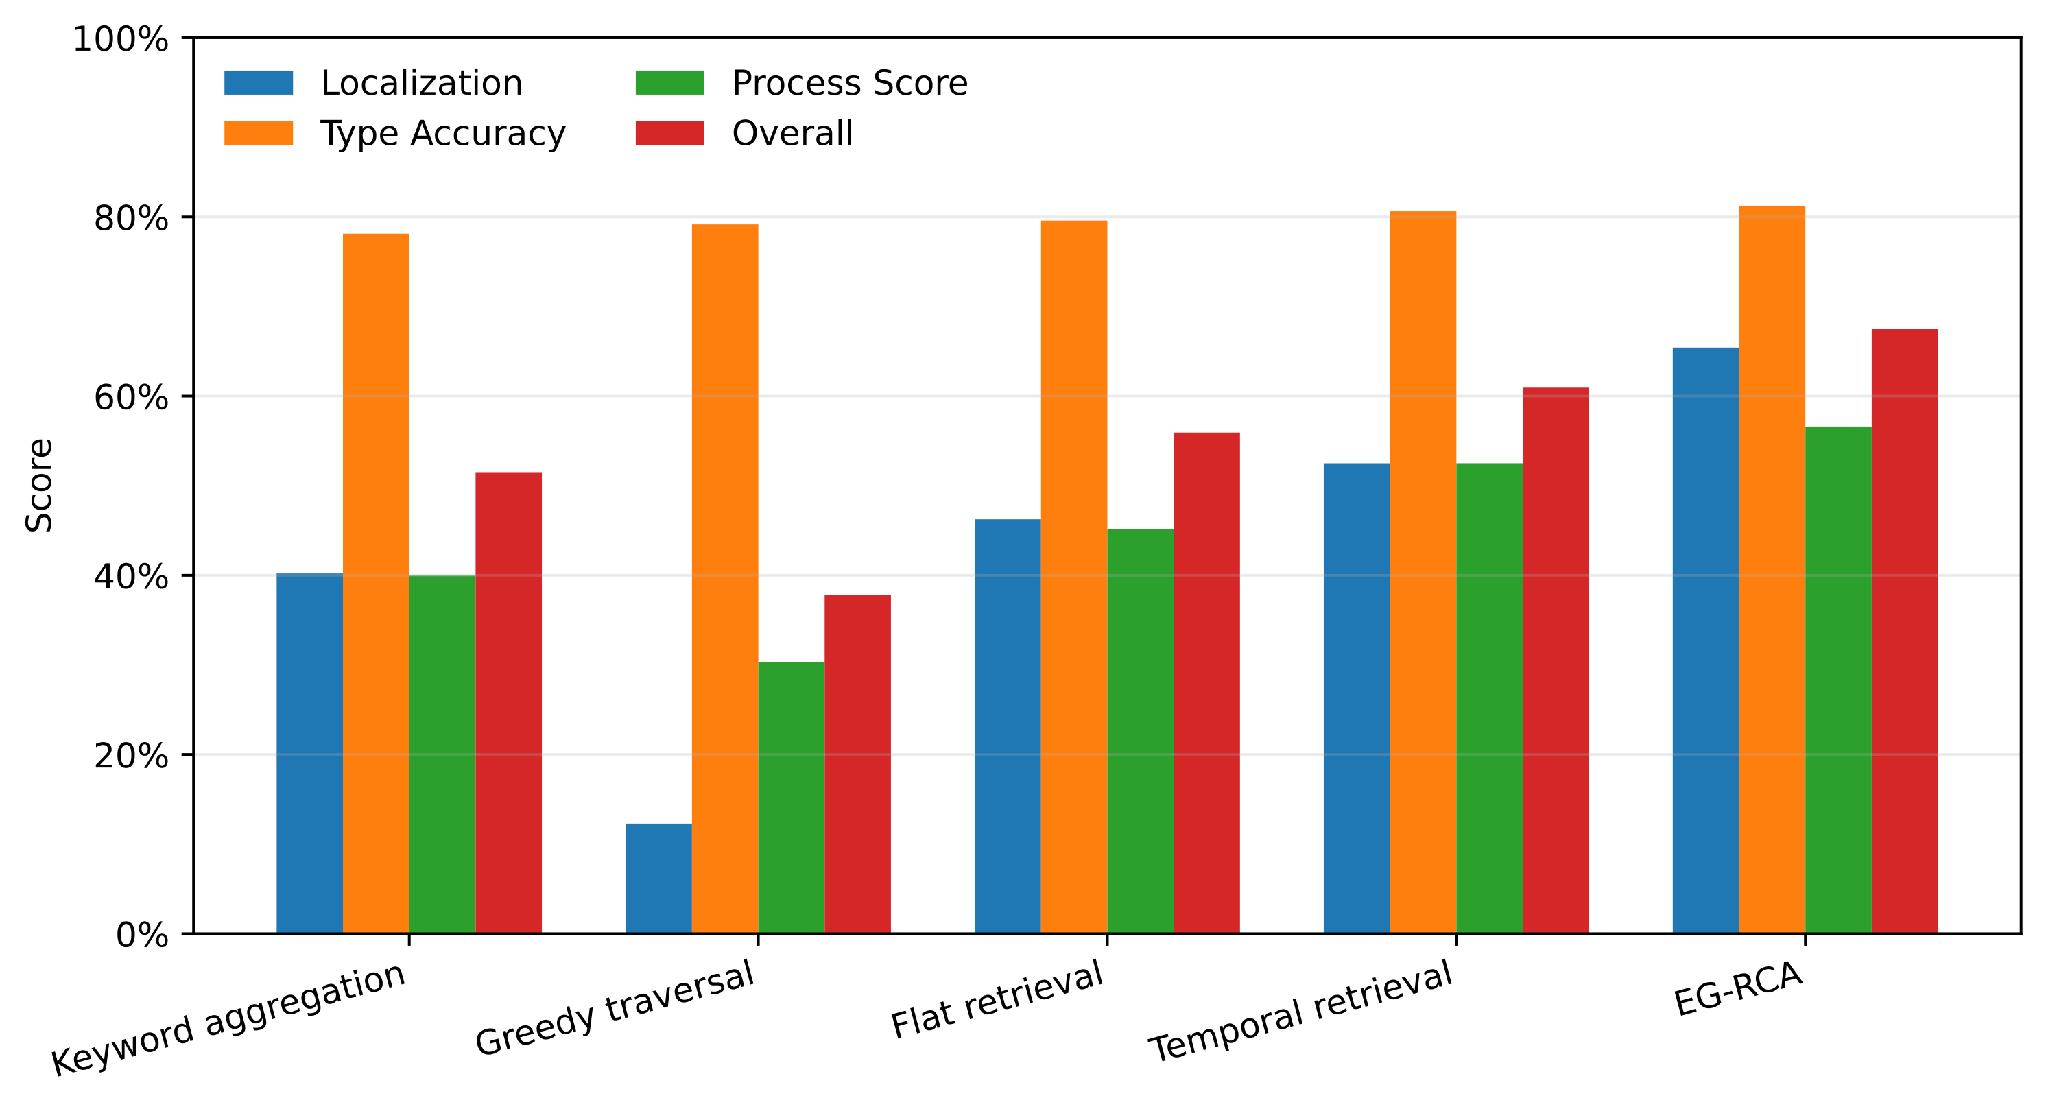
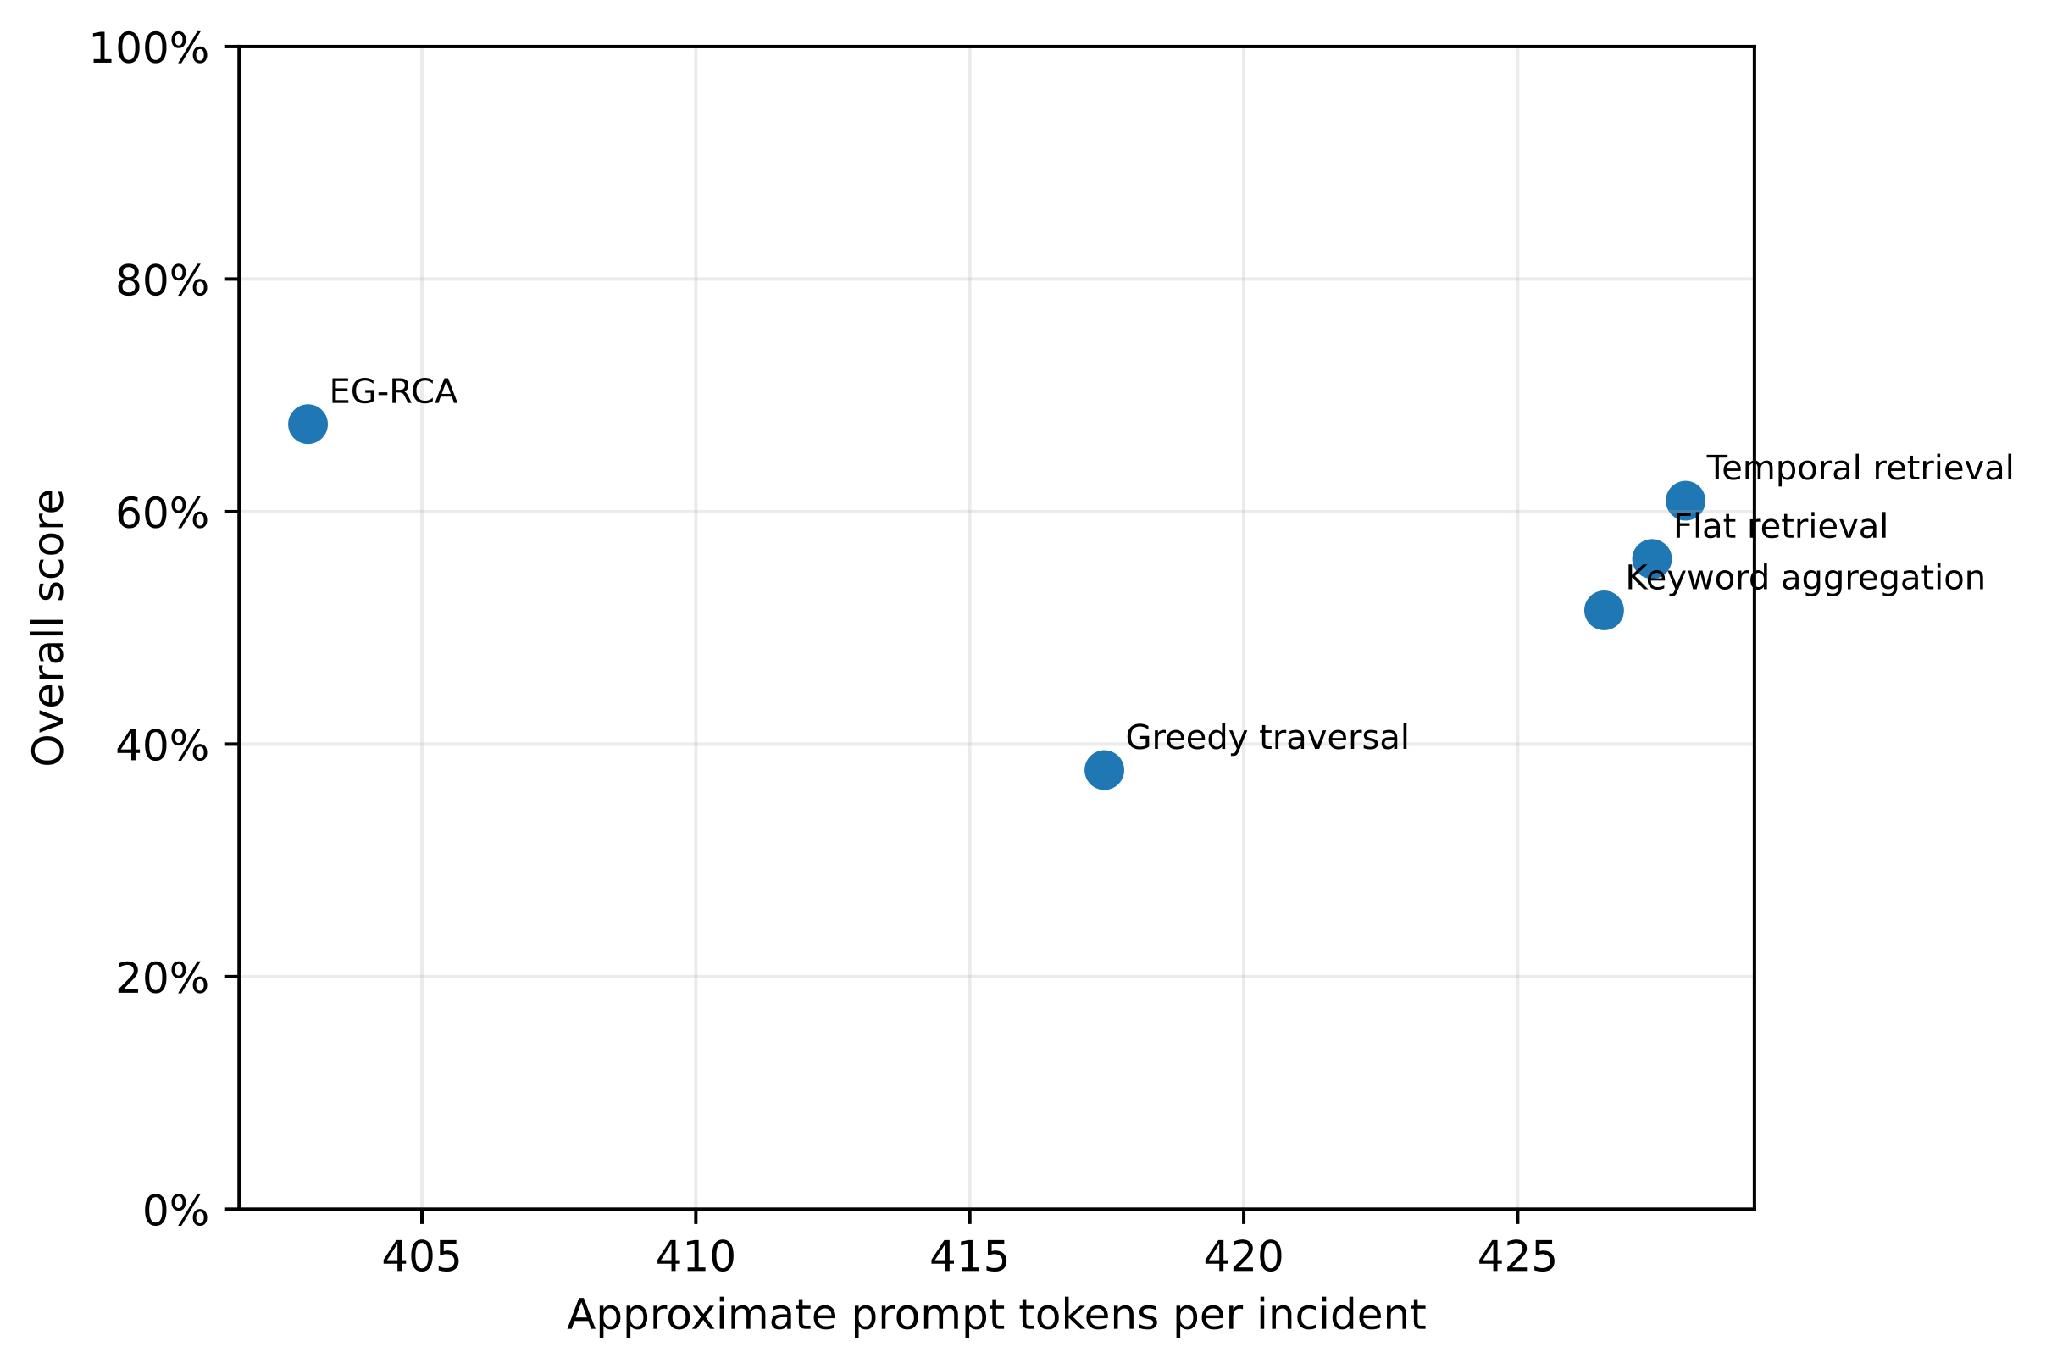
Table 3 reports the controlled results with a matched 12-observation evidence budget for every method. EG-RCA obtains 65.4 % localization accuracy, 81.2 % type accuracy, a process score of 56.6, and an overall score of 67.5. Temporal Retrieval is the strongest retrieval baseline at 60.9 overall. The paired improvement over Temporal Retrieval is 6.58 percentage points, with a bootstrap 95 % interval of 3.49–9.91 points. The improvement over Flat Retrieval is 11.59 points, with an interval of 8.00–15.12 points.
Relative to Temporal Retrieval, localization improves by 12.9 points and Chain F1 by 11.9 points, while type accuracy differs by only 0.6 points in favor of EG-RCA. The main controlled gain therefore comes from root attribution and path quality rather than fault-family classification.
Table 3.
Controlled results over 480 incidents with a matched k=12 evidence budget for all methods. Scores are macro-averaged percentages; higher is better except prompt tokens. Overall intervals are percentile-bootstrap 95 % confidence intervals. Displayed components are rounded independently
| Metric | Keyword aggregation | Greedy traversal | Flat retrieval | Temporal retrieval | EG-RCA |
|---|---|---|---|---|---|
| Loc. | 40.2 | 12.3 | 46.2 | 52.5 | 65.4 |
| Type | 78.1 | 79.2 | 79.6 | 80.6 | 81.2 |
| Ev. P | 22.0 | 28.9 | 24.9 | 30.1 | 29.5 |
| Ev. R | 63.1 | 81.8 | 71.9 | 86.5 | 75.9 |
| Ev. F1 | 32.5 | 42.5 | 36.8 | 44.5 | 42.2 |
| Chain | 49.0 | 15.5 | 55.4 | 62.3 | 74.2 |
| Process | 40.0 | 30.3 | 45.2 | 52.5 | 56.6 |
| Overall (95% CI) | 51.5 [48.4, 54.5] | 37.8 [35.7, 39.8] | 55.9 [52.9, 58.8] | 60.9 [58.0, 64.0] | 67.5 [64.3, 70.6] |
| Tokens | 427 | 417 | 427 | 428 | 403 |
Performance by Fault Category
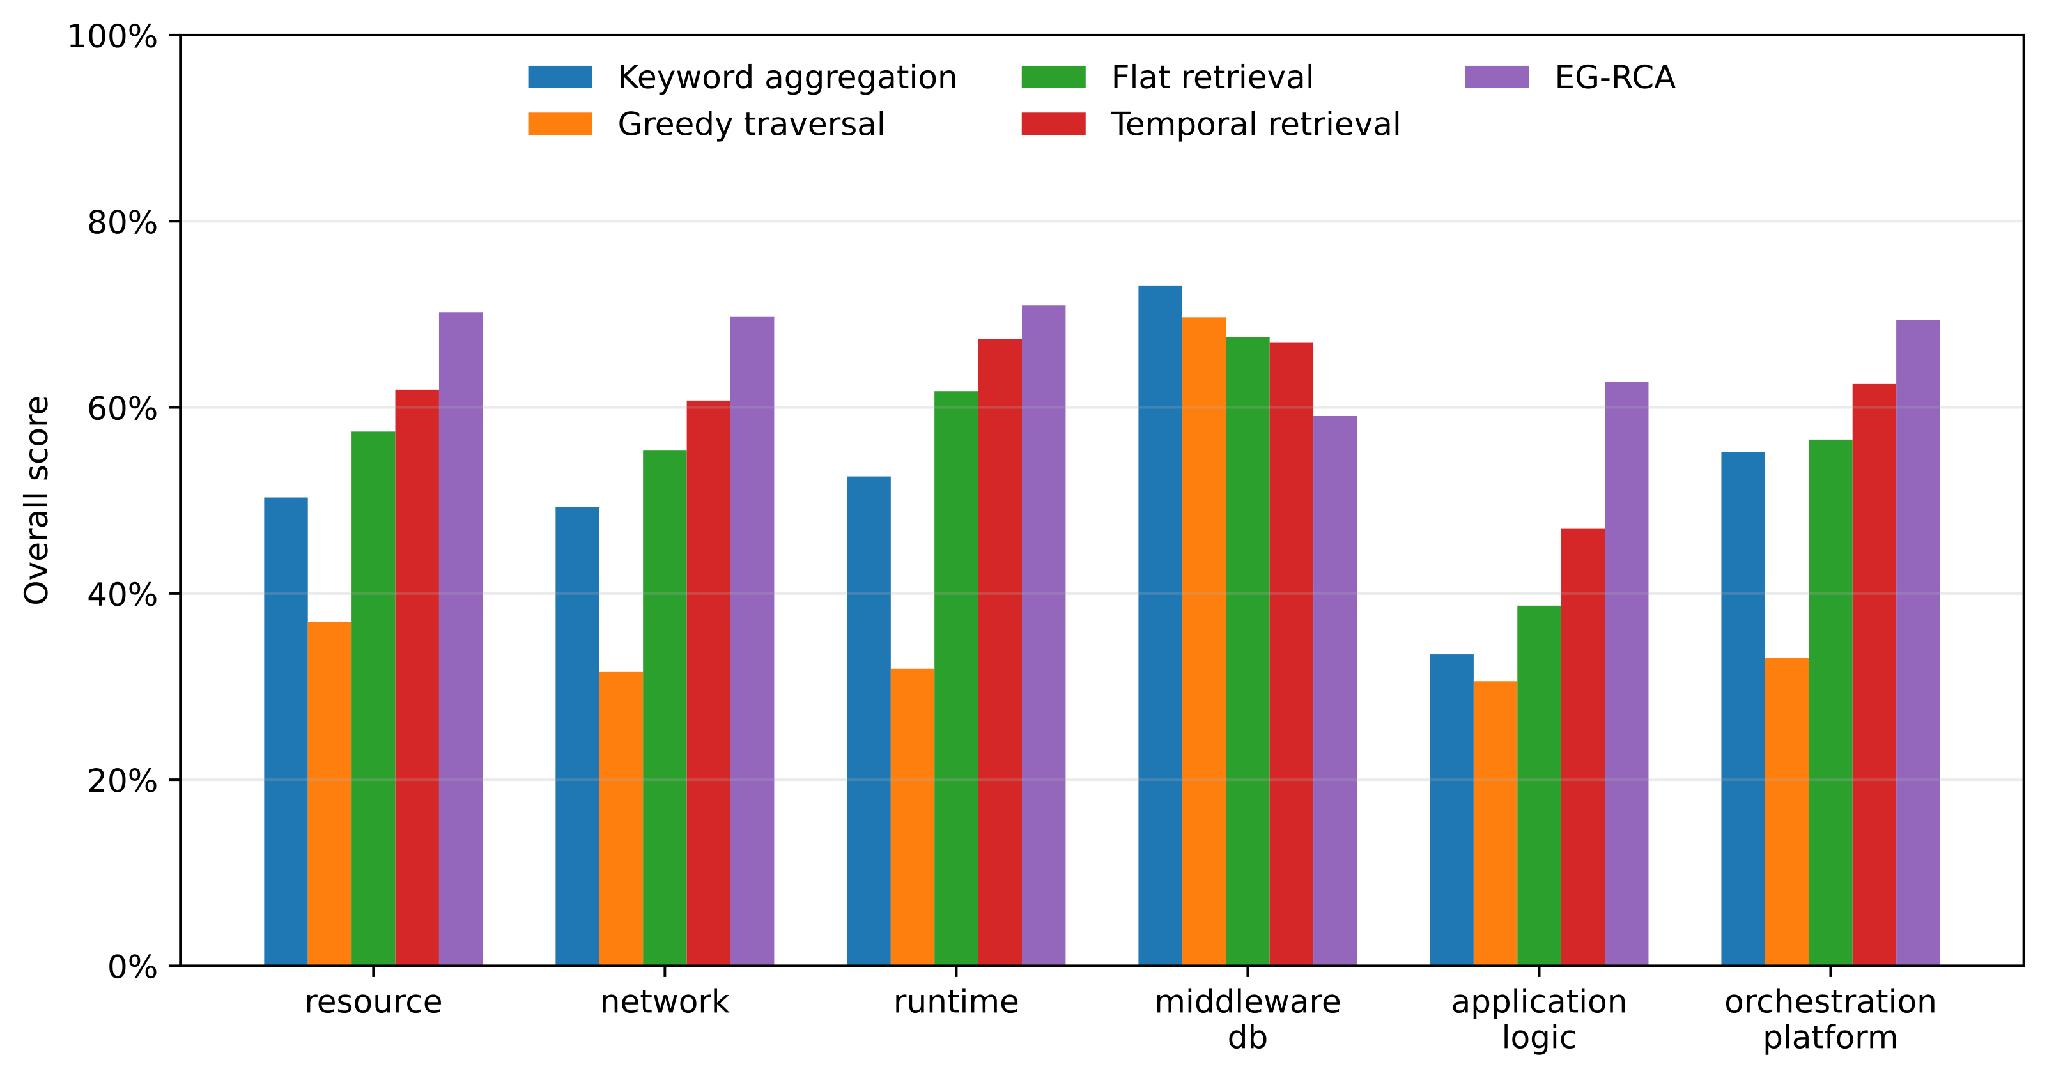
Figure 3 shows category-level results. EG-RCA has the highest overall score in five of six categories: runtime (70.9), resource (70.2), network (69.7), orchestration/platform (69.4), and application logic (62.7). Keyword Aggregation leads middleware/database incidents at 73.1, compared with 59.1 for EG-RCA. Explicit SQL and Redis vocabulary makes that category favorable to lexical matching in the controlled reference corpus. Application-logic failures remain difficult because a downstream HTTP error and an initiating application defect can produce nearly identical text.
Evidence Budget and Context Efficiency
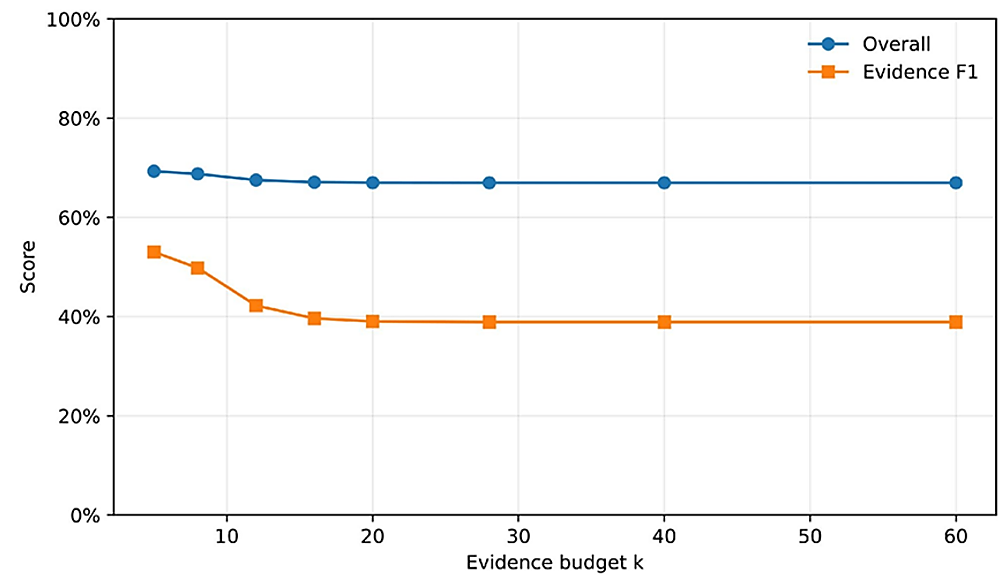
Figure 4 evaluates evidence budget on the same 480 incidents as the main experiment. Overall score is 69.3 at , 68.8 at , and 67.5 at . The decline after is modest, while evidence recall rises from 59.2 % at to 75.9 % at . The main configuration uses to preserve a broader auditable evidence set while keeping the prompt context bounded and slightly smaller than the retrieval baselines.
With the matched budget, all three ranking methods use comparable estimated prompt contexts of approximately 400–430 tokens per incident: 403 for EG-RCA, 428 for Temporal Retrieval, and 427 for Flat Retrieval. The diagnostic gain of EG-RCA therefore does not result from a larger evidence budget or a larger estimated prompt context. Figure 5 shows the corresponding quality–context trade-off.
LLM-in-the-Loop Pilot
Table 4 reports the recorded LLM outputs. Both contexts produce 75.0 % localization accuracy, 83.3 % type accuracy, and 75.0 % joint root/type accuracy. The candidate-aware context changes the quality of the supporting explanation: Evidence F1 increases from 57.0 to 75.4, and overall score rises from 74.5 to 77.6. The improvement comes from more complete and less extraneous citations rather than from additional correct root diagnoses.
The basic post-LLM checks accept 11 of 12 Flat Retrieval outputs and all 12 guided outputs. Acceptance does not imply correctness: structurally valid but incorrect hypotheses remain possible. Three guided diagnoses are wrong despite passing these checks. Acceptance therefore indicates consistency with the checked schema, evidence IDs, root support, and propagation path, not that the inferred cause is necessarily correct.
Table 4.
Recorded GPT-5.6 Sol Pro pilot on 12 held-out incidents. Scores are percentages; “Accepted” means that the output passed the basic schema, evidence-ID, root-support, and propagation-path checks
|
Context |
Loc. |
Type |
Joint |
Ev. F1 |
Overall |
Accepted |
|---|---|---|---|---|---|---|
|
Flat retrieval |
75.0 |
83.3 |
75.0 |
57.0 |
74.5 |
91.7 |
|
Frozen guided |
75.0 |
83.3 |
75.0 |
75.4 |
77.6 |
100.0 |
Large-Scale Production-Cluster Results
Table 5 reports the 24-window production-cluster evaluation. With the same evidence budget, EG-RCA reaches 89.5 overall, compared with 65.2 for Temporal Retrieval and 54.0 for Flat Retrieval. For EG-RCA, localization and fault-type accuracy are 95.8 % and 95.8 %, respectively. Because the production-cluster evaluation and the controlled corpus use different topologies and data distributions, their absolute scores are not directly comparable. The 24 measured windows characterize this evaluation campaign rather than production environments in general.
All methods ingest the full incident window through the same shared feature-index pass. The shared feature-index pass takes 6.03 s on average in the evaluated environment. With the matched budget, estimated prompt contexts are 418, 430, and 436 tokens for EG-RCA, Temporal Retrieval, and Flat Retrieval, respectively. The large-scale evaluation therefore examines diagnostic behavior at higher topology and telemetry volume rather than claiming an implementation-specific post-index speedup.
Table 5.
Production-cluster evaluation over 24 incident windows, 500 logical entities, 2,066 runtime instances, and 2,296,172 observations. All methods use. Ablation Study
|
Method |
Loc. |
Type |
Ev. F1 |
Chain |
Overall |
Tokens |
|---|---|---|---|---|---|---|
|
Flat retrieval |
58.3 |
62.5 |
23.6 |
59.2 |
54.0 |
436 |
|
Temporal retrieval |
70.8 |
70.8 |
35.3 |
72.7 |
65.2 |
430 |
|
EG-RCA |
95.8 |
95.8 |
57.6 |
95.8 |
89.5 |
418 |
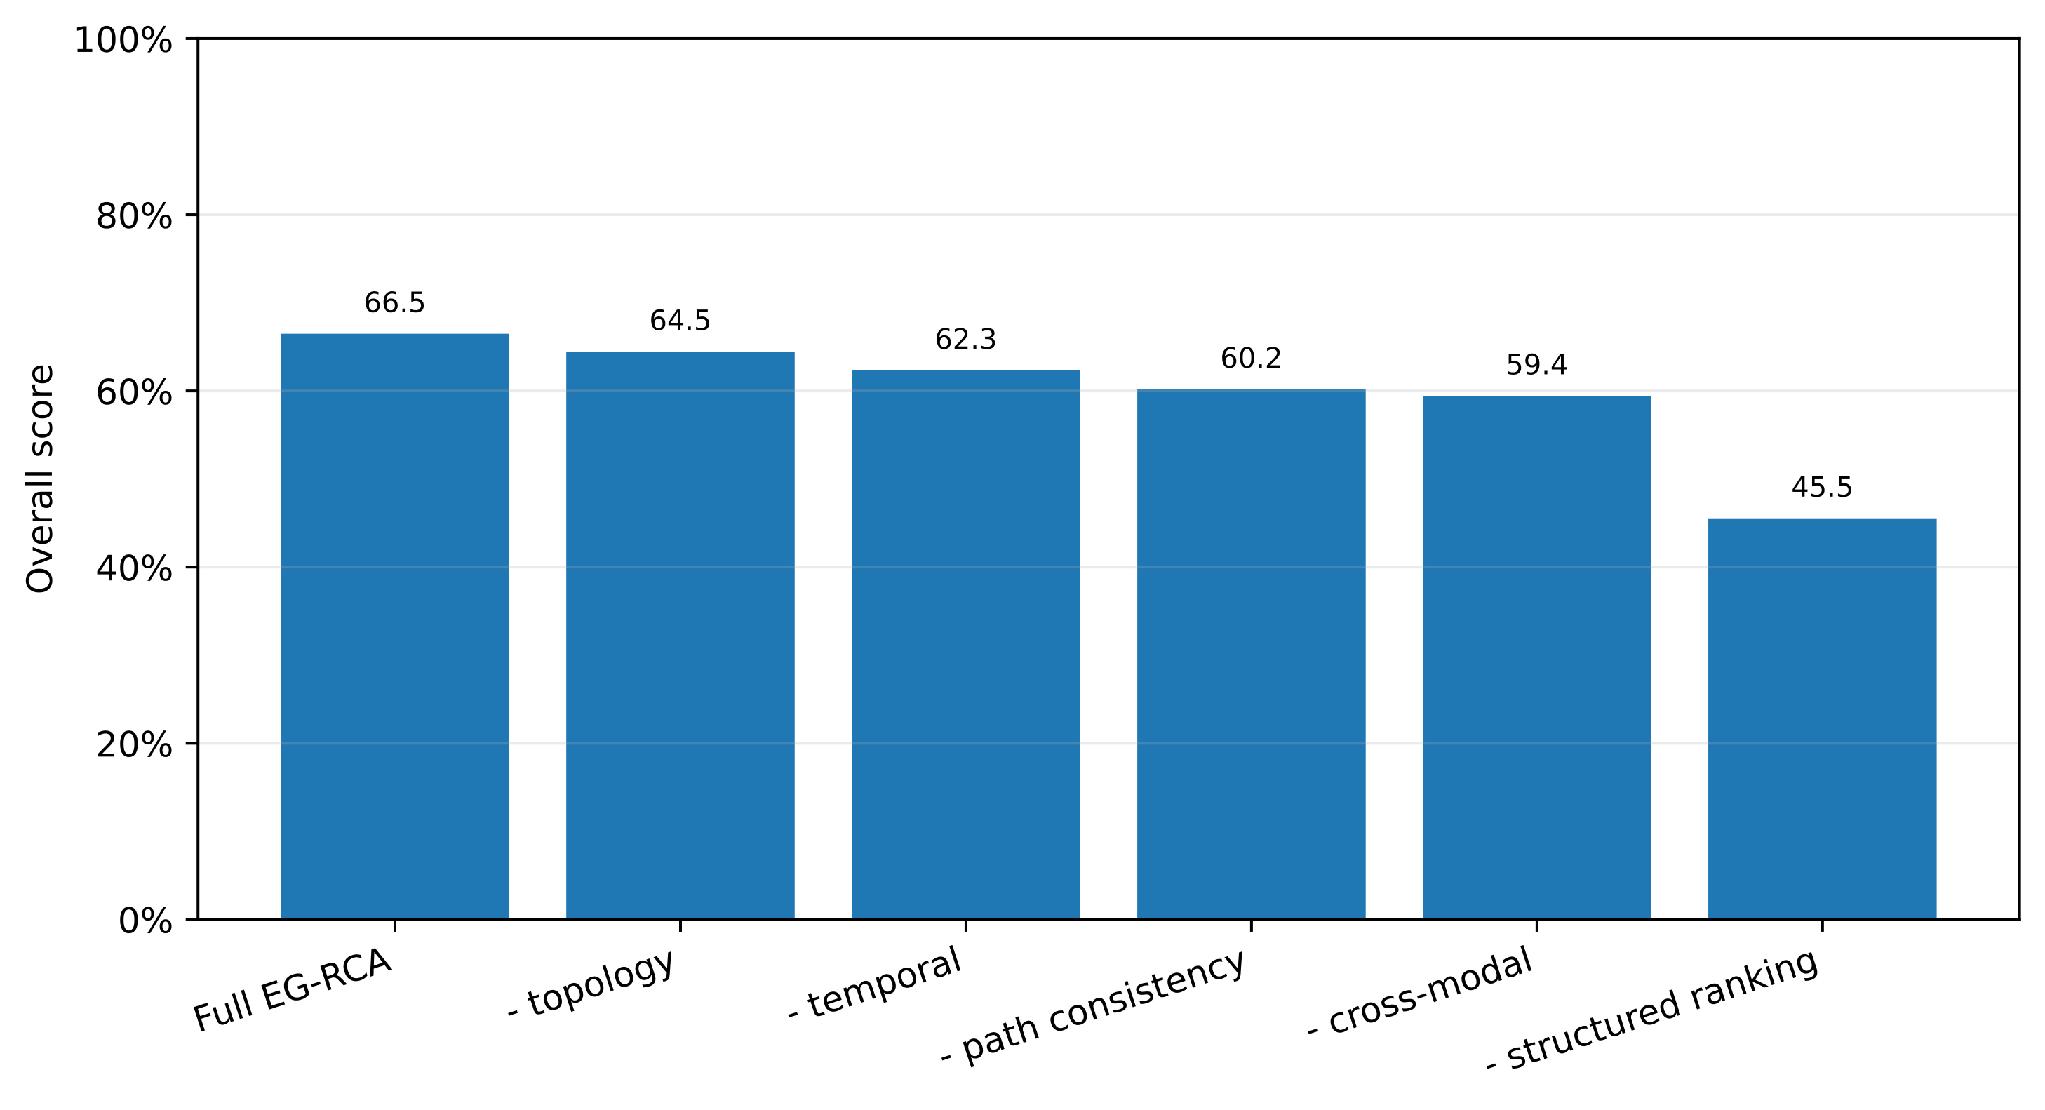
The ablation study uses the first 240 incidents from the seed-29 controlled corpus. Removing structured ranking causes the largest decrease, from 66.5 to 45.5 overall. Removing cross-modal support reduces the score by 7.1 points, removing pre-LLM path consistency by 6.3 points, removing temporal scoring by 4.2 points, and removing topology by 2.0 points. This ablation concerns candidate scoring before the LLM; it does not measure the post-LLM checks.
The no-ranking condition has higher Evidence F1 than the full method because anomaly-only selection retrieves many key IDs together with unrelated observations. Evidence overlap does not identify which entity initiated the incident or whether the observations form the correct path. Localization and Chain F1 capture that failure. Reporting evidence precision, recall, and path quality separately prevents Evidence F1 from being interpreted as a complete diagnosis metric.
Table 6.
Ablation results on 240 incidents. Scores are percentages.
|
Metric |
Full EG-RCA |
cross-modal support |
temporal scoring |
topology |
path consistency |
structured ranking |
|---|---|---|---|---|---|---|
|
Loc. |
64.2 |
53.8 |
58.8 |
59.6 |
54.6 |
29.2 |
|
Type |
80.8 |
77.1 |
77.9 |
80.8 |
78.8 |
67.5 |
|
Ev. P |
28.5 |
25.9 |
27.2 |
29.6 |
26.0 |
34.3 |
|
Ev. R |
74.5 |
67.8 |
70.6 |
84.8 |
69.3 |
98.0 |
|
Ev. F1 |
41.0 |
37.3 |
39.1 |
43.7 |
37.6 |
50.7 |
|
Chain |
72.6 |
64.1 |
66.7 |
67.8 |
63.1 |
39.0 |
|
Process |
55.2 |
49.3 |
51.5 |
54.6 |
49.1 |
45.4 |
|
Overall |
66.5 |
59.4 |
62.3 |
64.4 |
60.2 |
45.5 |
Case Study
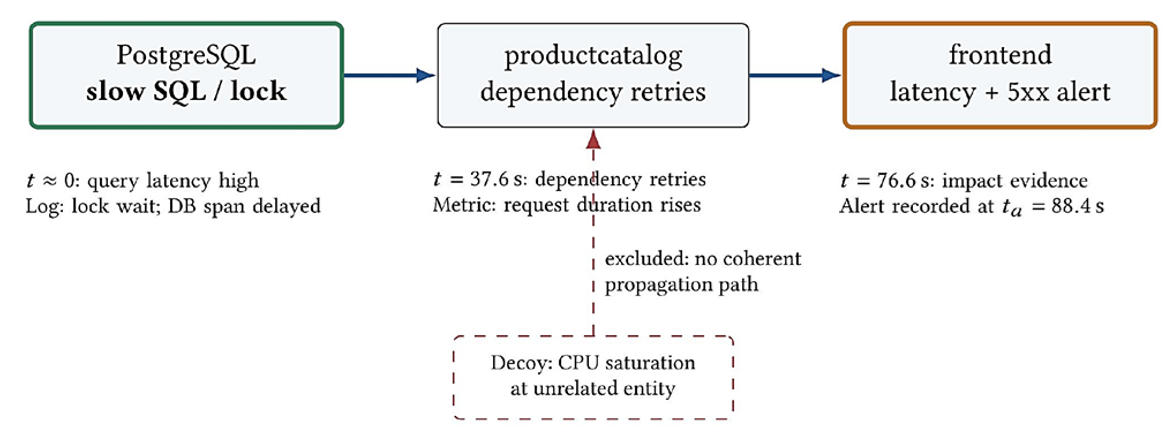
Figure 7 illustrates a controlled reference slow-SQL incident. PostgreSQL emits metric, log, and trace evidence near indicating a lock-related query delay. At , the product-catalog service shows dependency retries and increased span duration. At , the frontend produces user-visible latency and error evidence; the incident alert time is . The resulting propagation path consists of postgres, productcatalog, and frontend, in that order.
A CPU-saturation cluster at an unrelated service can receive high semantic and anomaly scores. Flat retrieval may rank it highly. The EG-RCA path-consistency stage excludes that candidate because no directed propagation path connects the candidate entity to the frontend alert. The retained output cites evidence IDs, allowing an operator to inspect each supporting observation.
Discussion
Effect of Verification
Temporal Retrieval and EG-RCA have similar type accuracy, but EG-RCA improves root localization and path quality. Semantic evidence is often sufficient to recognize a fault family such as packet loss, full GC, or slow SQL. The larger error source is assigning that fault to the initiating entity and connecting it to the observed alert.
The post-LLM verifier specifies explicit checks for the selected explanation. A database explanation must connect to a caller, a lifecycle explanation must cite an event, root evidence should precede downstream impact, and numeric claims must match structured values. The pilot evaluates only the basic schema, citation-ID, root-support, and propagation-path subset of these checks. These checks can reject explanations that violate the encoded consistency conditions, but the current experiment does not isolate their causal effect on diagnostic accuracy.
Relationship to AgenticOpsEval
Cai et al. provide key-evidence labels in AIOps2025 and causal-chain checkpoints in RCA100 [2]. Equation (5) supports key-evidence ranking, while Eq. (19) scores path consistency. The next external validation should run EG-RCA on both datasets and report their native scoring protocols alongside Eq. (23); the controlled process score used here should not be interpreted as a native AgenticOpsEval or RCA100 score.
The architecture also fits interactive environments. AIOpsLab provides live fault injection and tool execution [4]; ITBench and SREGym can test whether evidence-grounded diagnosis improves subsequent remediation [6, 11]. In such deployments, the verifier should remain between diagnosis and action, and proposed commands should pass separate policy, blast-radius, and rollback controls.
From RCA to Semi-Autonomous Remediation
The same interface can be extended from diagnosis to remediation. A remediation proposal should identify its target entity, preconditions, expected effect, validation query, and rollback operation. Prior incident-mitigation research also supports grounding corrective actions in operational evidence and executable guidance [12]. The workflow can be separated into the following stages:
A correct diagnosis does not guarantee a safe change. Increasing a connection pool, for example, may reduce local queueing while increasing database saturation. Remediation therefore requires controls beyond diagnostic evidence verification.
Threats to Validity
Production measurement scope
The controlled corpus provides exact labels and repeatability, while the large-scale evaluation uses measured telemetry from one production cluster. Results may differ across clusters, traffic regimes, instrumentation quality, and concurrent-fault conditions.
Evaluation design and selection effects
The controlled corpus is structured to test temporal, topological, and evidence-grounding mechanisms. The production-cluster evaluation reduces dependence on that construction, but incident selection, labeling, topology snapshots, and evidence annotation can still affect results. Independent benchmark and multi-cluster validation remain necessary.
Deterministic controlled strategies
The 480-incident comparison uses deterministic strategy implementations. This isolates candidate ranking and evidence orchestration from model behavior but does not measure hallucination, tool-selection error, or prompt sensitivity. The separate frozen LLM pilot covers candidate-aware prompting and basic post-LLM checks on only 12 incidents; it does not evaluate the full verifier or establish model-level generality.
Topology and fault-catalog coverage
The evaluation uses a 15-entity controlled topology and a measured production topology with 500 logical entities; both use the same 12-type evaluation taxonomy. The production-cluster measurement adds runtime replicas, shared infrastructure, longer paths, and high-volume telemetry, but one cluster cannot establish coverage of regional failover, asynchronous business workflows, or continuously changing service discovery. A deployed topology may also be incomplete or stale.
Metric design
Equation (23) assigns 40 % to localization, 30 % to fault type, and 30 % to process quality. The 0.40/0.30/0.30 weights mirror the entity/fault/process emphasis of RCA100, but the process term is our controlled surrogate rather than the native RCA100 process metric. The weights remain a design choice. Evidence F1 also ignores attribution unless it is paired with localization and path metrics.
Approximate context cost
Prompt tokens are estimated from lexical word counts and fixed metadata allowances rather than a model-specific tokenizer. Repeated words are counted separately. Controlled runtime excludes LLM inference, network latency, telemetry queries, and tool execution.
Operational Safety and Ethics
An RCA agent may access logs containing secrets, personal data, customer identifiers, or proprietary source information. Evidence normalization should enforce access control, field-level redaction, retention limits, and auditable data lineage. The LLM should receive only the observations needed for the incident.
The system described here does not autonomously modify infrastructure. Diagnosis and remediation permissions should remain separate. High-impact actions require policy evaluation and, where appropriate, human approval. Passing the evidence checks does not imply that a remediation action is safe.
Conclusion
This paper presented EG-RCA, an architecture for improving LLM root cause analysis with bounded evidence selection and deterministic verification. The controlled candidate-ranking evaluation showed higher localization, path quality, and overall score than lexical, traversal, and retrieval baselines under a matched evidence budget. A separate 500-entity production-cluster evaluation measured the same ranking design at roughly 50,013–146,879 observations per incident window. The recorded LLM pilot had higher Evidence F1 with candidate-aware context while root/type accuracy was unchanged on the 12-case sample.
The results support separating hypothesis generation from evidence validation in LLM-based AIOps systems. They do not establish production readiness. Evaluation on expert-labeled benchmarks, multiple model families, incomplete topologies, and interactive remediation tasks remains necessary.
Appendix A. Controlled Fault Taxonomy
Table 7.
Fault types used in the controlled evaluation.
|
Category |
Fault types |
|---|---|
|
Resource |
CPU saturation; memory pressure |
|
Network |
network latency; packet loss |
|
Runtime |
full GC; thread exhaustion |
|
Middleware/DB |
slow SQL; Redis unavailable |
|
Application logic |
HTTP 5xx; rate limiting |
|
Orchestration/platform |
pod CrashLoop; DNS failure |
Appendix B. Scoring Configuration
Table 8.
Main EG-RCA parameters.
|
Parameter |
Value |
|---|---|
|
Semantic weight |
0.34 |
|
Temporal weight |
0.18 |
|
Anomaly weight |
0.16 |
|
Topology weight |
0.16 |
|
Modality weight |
0.10 |
|
Alert relevance |
0.06 |
|
Temporal scale |
36 s |
|
Base delay |
52 s |
|
Per-hop delay |
18 s |
|
After-alert factor |
0.25 |
|
Temporal-order tolerance |
4 s |
|
Topology scale |
3.1 |
|
Root evidence count |
4 |
|
Desired modalities |
3 |
|
Cross-modal relevance threshold |
0.30 |
|
Candidate count |
2 |
|
Root weight |
0.34 |
|
Coverage weight |
0.38 |
|
Order weight |
0.28 |
|
Pre-LLM path-consistency |
0.40 |
|
Cross-modal weight |
0.08 |
|
Evidence budget |
12 |
Controlled implementation details
The pre-LLM path scorer uses root admissibility thresholds and anomaly magnitude ; downstream path evidence requires a propagation-related term and anomaly magnitude . Evidence-context ranking adds a root bonus of 0.12 and a path bonus of 0.05. The prompt-cost estimator uses a 90-word fixed instruction/schema budget, 8 metadata words per selected observation, and 0.75 words per approximate token. These constants are also recorded in the accompanying code.
Appendix C. Baseline Configuration
Flat and Temporal Retrieval share a two-stage fault-family and entity-localization procedure but use different evidence weights. Table 9 records their controlled configuration. Keyword Aggregation and Greedy Traversal do not use this weight vector. All five methods in Table 3 use the same final evidence budget .
Table 9.
Controlled Flat and Temporal Retrieval parameters.
|
Parameter |
Flat |
Temporal |
|---|---|---|
|
Semantic |
0.56 |
0.40 |
|
Temporal |
0.00 |
0.20 |
|
Anomaly |
0.18 |
0.15 |
|
Topology |
0.10 |
0.12 |
|
Modality |
0.10 |
0.08 |
|
Alert relevance |
0.06 |
0.05 |
|
Cross-modal weight |
0.04 |
0.05 |
|
Cross-modal threshold |
0.28 |
0.28 |
|
Disconnected penalty |
-0.14 |
-0.14 |
|
Global fault evidence count |
8 |
8 |
|
Entity evidence count |
5 |
5 |
|
Evidence budget |
12 |
12 |
Appendix D. Temporal-Prior Sensitivity
To check that the controlled result is not tied to the exact temporal-prior constants, we reevaluate the first 240 seed-29 incidents under four parameter settings. The scorer never receives the reference incident onset. Table 10 shows that EG-RCA remains ahead of Temporal Retrieval for each tested prior, although absolute performance varies with the assumed propagation delay.
Table 10.
Sensitivity to the temporal prior on 240 fixed incidents. Scores are percentages.
|
Setting |
Temporal |
EG-RCA |
|||
|---|---|---|---|---|---|
|
Main |
52 |
18 |
36 |
60.2 |
66.5 |
|
Shorter delay |
40 |
12 |
48 |
55.2 |
59.8 |
|
Longer delay |
68 |
24 |
48 |
62.0 |
66.9 |
|
Weak temporal prior |
52 |
18 |
72 |
59.2 |
65.0 |
Appendix E. Topology-Valid Distractor Stress Test
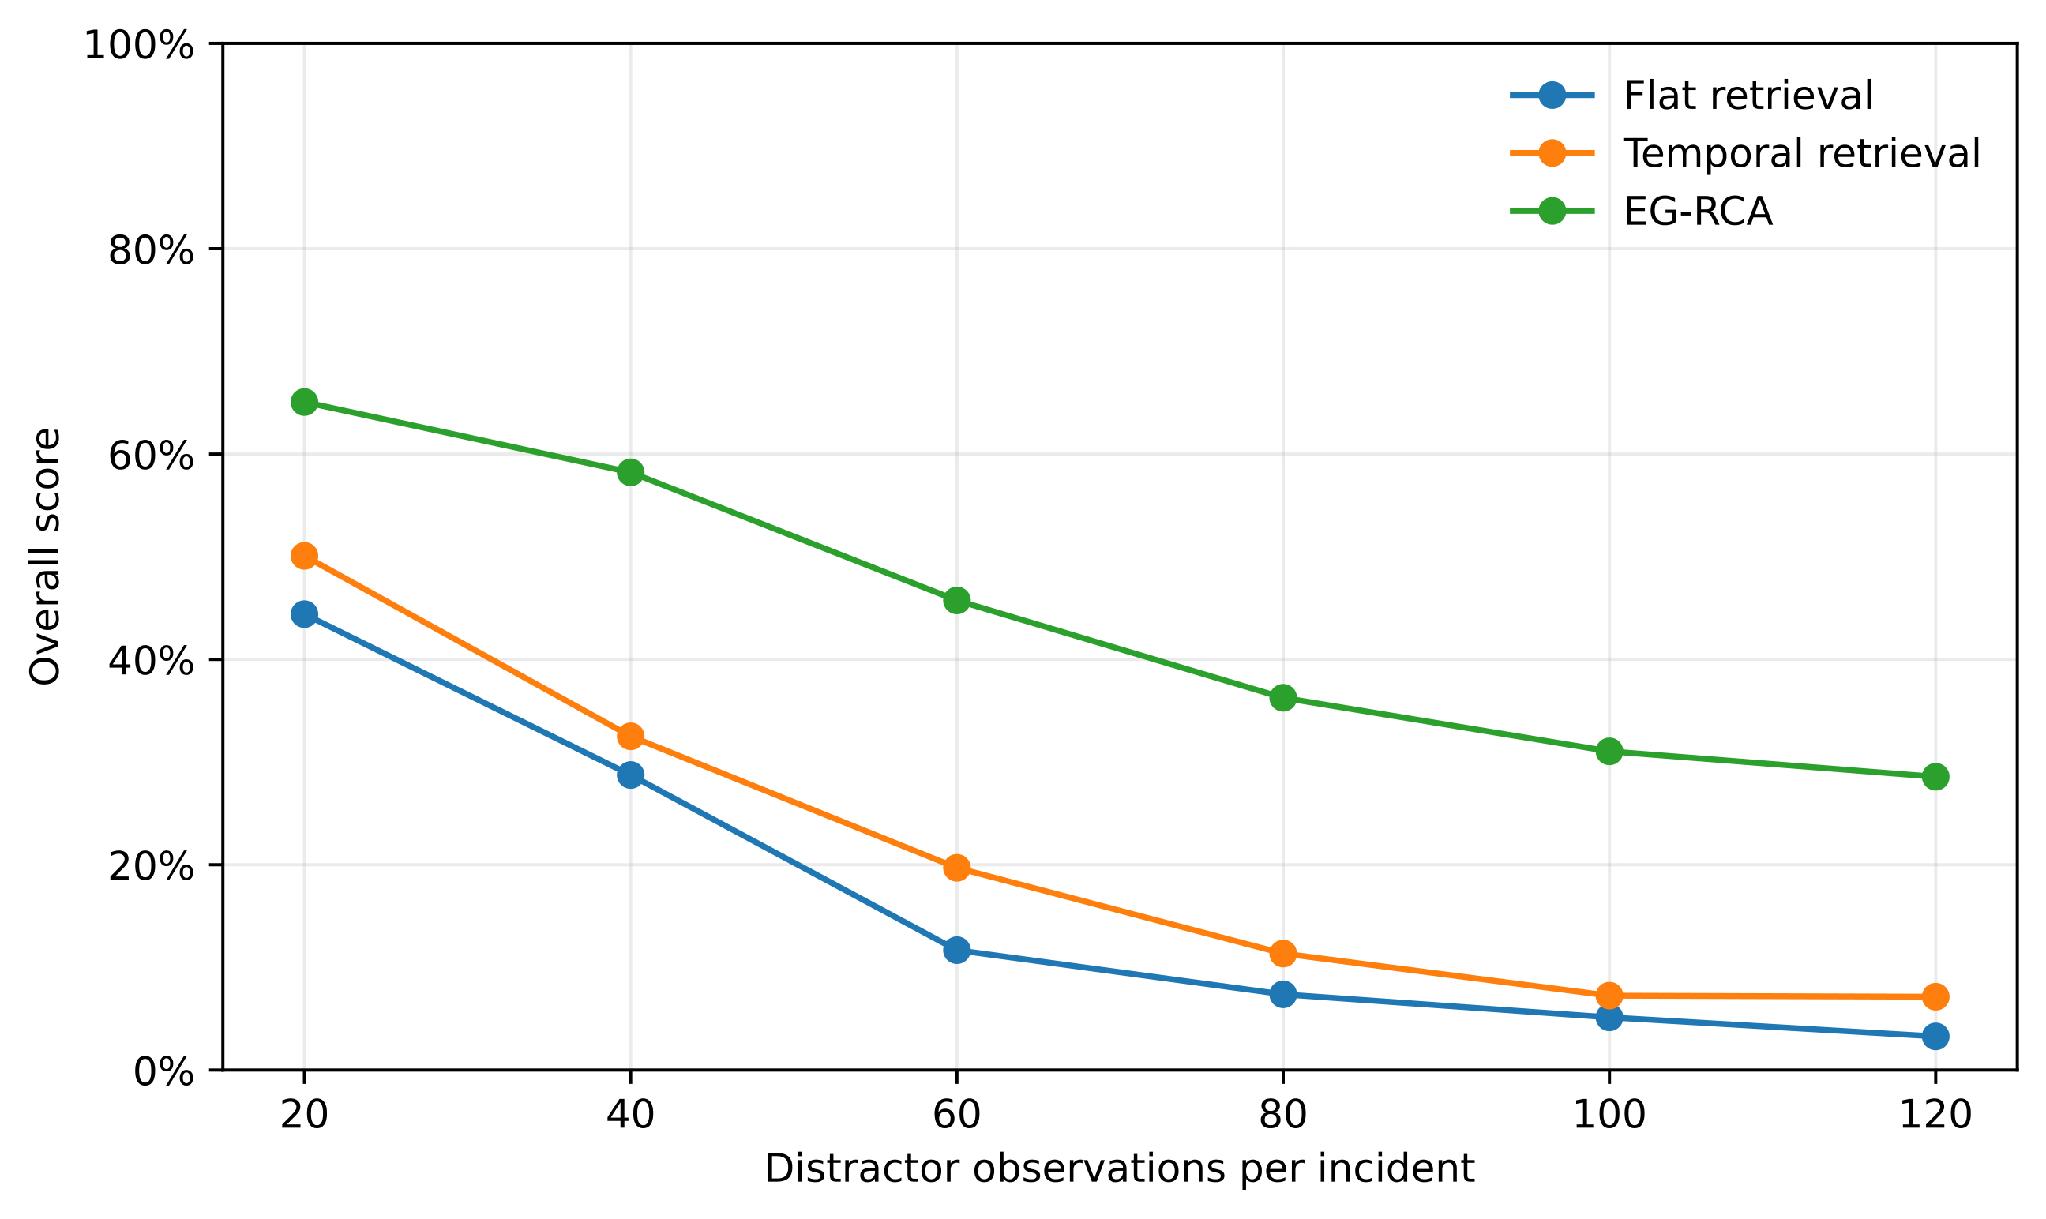
The stress test uses 90 fixed reference incidents constructed with seed 1029 and increases the number of semantically plausible observations attached to entities that retain a propagation path to the alert. At 20 distractor observations, EG-RCA reaches 65.1 overall, compared with 44.4 for Flat Retrieval and 50.1 for Temporal Retrieval. At 120 distractors, EG-RCA reaches 28.6, Temporal Retrieval 7.2, and Flat Retrieval 3.3. EG-RCA remains ahead at all tested noise levels, but its score falls substantially as topology-valid contamination increases.
Appendix F. Reproducibility
The accompanying artifact includes reference-workload construction scripts, parameters, per-incident outputs, bootstrap intervals, tables, figures, frozen LLM prompts and responses, and scoring code. The controlled evaluation uses seed 29; ablation and temporal-prior studies use its first 240 incidents, and the topology-valid noise test uses seed 1029. The large-scale production-cluster evaluation is reproduced from exported incident windows, the topology snapshot, runtime-instance mapping, labels, and evaluation outputs included in the accompanying artifact. The LLM pilot uses seed 260824 and can be rescored exactly from its recorded outputs; its frozen prompt set predates the revised single-entity temporal-order convention and is not part of the revised controlled-score comparison.
References