Assessment of spatial and environmental deficits in Tashkent residential development by morphological type
УДК – 711.4
Abstract
The study assesses spatial and environmental stress across morphological types of Tashkent’s residential fabric. The analysis was conducted in QGIS using 983 territorial units and combines morphometric indicators, street-network parameters, and recreational accessibility. Morphometric deficit was defined relative to FSI, GSI, and OSR distributions within each morphotype. Network deficit was assessed through node and intersection density, while recreational deficit was measured by network distance to the nearest recreational space. The diagnostic variables were integrated into a five-level stress scale. High or critical stress was identified in 48.0 % of the analysed territories. The highest shares occurred in transformed mahalla development M1b (74.8 %) and traditional M1a (64.8 %), while the lowest were recorded for microdistrict types M2a (16.8 %) and M2b (14.3 %). The results show that stress is not linearly determined by density but depends on morphology, connectivity, and recreational accessibility. The approach can identify areas where further densification requires restrictions or compensatory planning measures, providing a practical basis for differentiated regulation of residential development according to its initial morphological structure.
Аннотация
Цель исследования — выявить различия в пространственно-средовой напряжённости основных морфологических типов жилой ткани Ташкента на основе комплексной пространственной диагностики. Исследование выполнено в QGIS на выборке из 983 территориальных единиц и объединяет морфометрические характеристики, параметры улично-пешеходной сети и рекреационную доступность. Морфометрический дефицит определялся относительно распределения FSI, GSI и OSR внутри каждого морфотипа. Сетевой дефицит оценивался по плотности узлов и пересечений, а рекреационный — по сетевому расстоянию до ближайшего рекреационного пространства. Диагностические признаки объединены в пятиуровневую шкалу пространственно-средовой напряжённости. Высокий или критический уровень выявлен для 48,0 % исследованных территорий. Наибольшая доля таких территорий установлена для трансформированной махаллинской застройки M1b — 74,8 % и традиционной M1a — 64,8 %, а наименьшая — для микрорайонных типов M2a и M2b: 16,8 и 14,3 % соответственно. Результаты показывают, что напряжённость не определяется плотностью линейно, а формируется сочетанием морфологии, связности и рекреационной доступности. Предложенный подход может применяться для предварительного выявления территорий, где дальнейшее уплотнение требует ограничений или компенсирующих планировочных мер при градостроительном регулировании жилой застройки.
Keywords: Tashkent; residential development; densification; urban morphology; morphotype; spatial and environmental deficits; recreational accessibility.
Ключевые слова: Ташкент; жилая застройка; уплотнение; городская морфология; морфотип; пространственно-средовые дефициты; рекреационная доступность.
Introduction
Residential densification affects not only development intensity but also the organization of open spaces, pedestrian connectivity, and access to recreational areas. Similar density values may correspond to substantially different spatial conditions; therefore, density alone is insufficient to characterize the environmental performance of residential areas. This issue is particularly relevant to Tashkent, where traditional mahalla fabric, Soviet microdistricts, and contemporary mid- and high-rise residential developments coexist. Their contrasting spatial structures respond differently to densification.
The Spacematrix approach developed by M. Berghauser Pont and P. Haupt treats density as a multidimensional characteristic of urban form [1]. A. Dragutinovic, W. Quist, and U. Pottgiesser emphasize the role of open-space morphology in residential environments [2], while S. Ibrahim et al. demonstrate links between urban morphology, street-network configuration, and walkability [3]. These findings support an integrated assessment combining morphometric characteristics, spatial connectivity, and recreational accessibility.
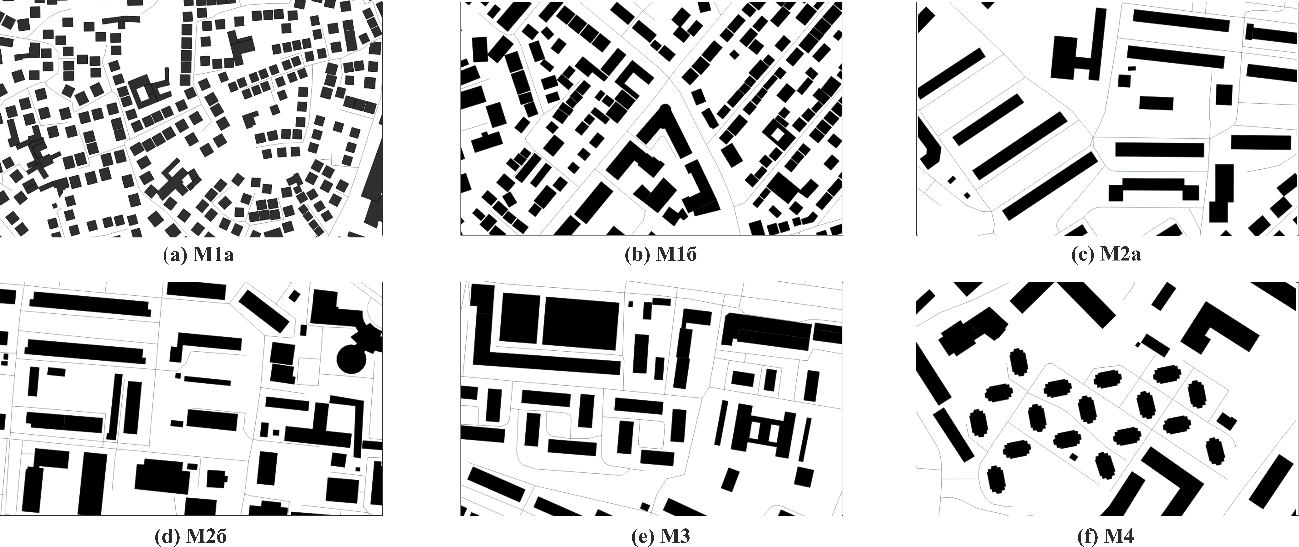
A previous analysis of Tashkent’s residential fabric [4] identified six main morphotypes: M1a — traditional mahalla development; M1b — transformed mahalla development; M2a — classic Soviet microdistrict; M2b — transformed microdistrict; M3 — compact mid-rise development; and M4 — high-rise intensive development.
The aim of this study is to identify differences in spatial and environmental stress among the main residential morphotypes of Tashkent through an integrated assessment of morphometric, network, and recreational characteristics.
Materials and Methods
The study was conducted in QGIS using a geospatial database of Tashkent residential areas, including residential boundaries, buildings, the street and pedestrian network, and recreational spaces. After data preparation and filtering, the final sample comprised 983 territorial units.
Residential areas were classified into six morphotypes: M1a — traditional mahalla development; M1b — transformed mahalla development; M2a — classic Soviet microdistrict; M2b — transformed microdistrict; M3 — compact mid-rise development; and M4 — high-rise intensive development. Their characteristic spatial patterns are shown in Figure 1. Of the 983 units, 965 were assigned to these six stable morphotypes, while 17 were classified as mixed and one as transitional.
The integrated assessment included three components: morphometric, network, and recreational. The morphometric component used the Spacematrix indicators FSI, GSI, and OSR [1], previously applied to residential development in Tashkent [1, 4].
To account for differences between morphotypes, morphometric deficits were defined relative to the indicator distribution within each type rather than by a single citywide threshold. FSI or GSI values above the third quartile (q3) were considered high, while OSR values below the first quartile (q1) were considered low. A morphometric deficit was recorded when high FSI or GSI coincided with low OSR. The resulting thresholds are presented in Table 1.
Table 1.
Morphometric deficit thresholds by morphotype
| Morphotype | FSI (q_3) | GSI (q_3) | OSR (q_1) |
|---|---|---|---|
| M1a | 0.662 | 0.256 | 1.129 |
| M1b | 1.1495 | 0.3785 | 0.5015 |
| M2a | 0.982 | 0.226 | 0.7875 |
| M2b | 1.2815 | 0.280 | 0.582 |
| M3 | 1.779 | 0.309 | 0.393 |
| M4 | 3.287 | 0.377 | 0.1935 |
The network component characterized permeability through the density of street and pedestrian network nodes and intersections [5]. The lowest class was defined using the Jenks natural breaks method [6]; values below 2 nodes/ha were treated as an internal diagnostic threshold for network deficit.
The recreational component measured network distance from the centroid of each territorial unit to the nearest recreational space. Three categories were used: ≤500 m — no deficit; 500–1000 m — moderate deficit; >1000 m — pronounced deficit [7, 8]. The diagnostic variables were combined into an integrated stress index:
T=morph_def+net_def+rec_def, where morph_def and net_def take values of 0 or 1, and rec_def takes values of 0, 1, or 2 according to recreational accessibility.
The index defined five stress levels from 0 (balanced) to 4 (critical), which were subsequently compared across morphotypes.
Results and Discussion
The integrated assessment revealed substantial spatial variation across Tashkent (Figure 2). Of the 983 territorial units, 48.0 % were classified as having high or critical spatial and environmental stress.
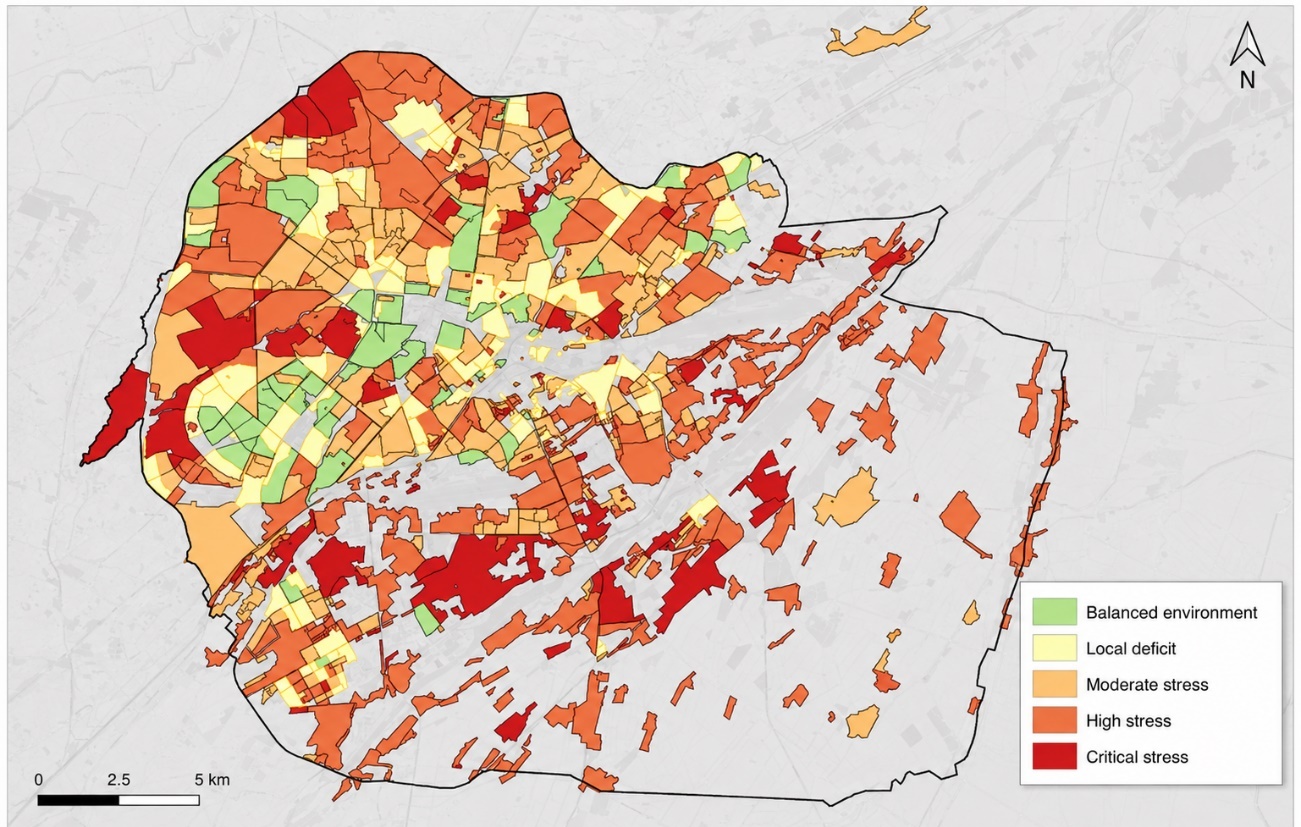
Comparison with the morphological typology revealed substantial differences between residential forms. The analysis covered 965 units assigned to the six stable morphotypes.
Table 2.
High and critical spatial and environmental stress by morphotype
| Morphotype | Total units | High | Critical | High + critical, % |
|---|---|---|---|---|
| M1a | 438 | 220 | 64 | 64.8 |
| M1b | 139 | 77 | 27 | 74.8 |
| M2a | 184 | 26 | 5 | 16.8 |
| M2b | 63 | 8 | 1 | 14.3 |
| M3 | 66 | 12 | 2 | 21.2 |
| M4 | 75 | 17 | 9 | 34.7 |
The highest shares of high and critical stress were found in M1b transformed mahalla development (74.8 %) and M1a traditional mahalla development (64.8 %). In M1b, this pattern is associated with transformation of the original low-rise fabric, increased building coverage, and reduction of internal open space. In M1a, much of the unbuilt land consists of private courtyards and gardens and is therefore not equivalent to publicly accessible recreational space. The distinction between private and publicly accessible green space is important when evaluating actual recreational accessibility [9].
The lowest shares were recorded in the microdistrict types: 16.8 % in M2a and 14.3 % in M2b. This may be related to the presence of large inter-building spaces and the remaining spatial reserve of the microdistrict structure. The role of open inter-building spaces as a structural element of mass housing is also emphasized by Dragutinovic, Quist, and Pottgiesser [2]. However, continued infill development may gradually reduce this reserve.
Morphotype M3 occupies an intermediate position, with high and critical stress affecting 21.2 % of the analysed units. For M4, the corresponding share is 34.7 %. Although M4 is characterized by the highest development intensity, it does not show the highest stress level. This indicates that spatial and environmental stress is not linearly determined by density, but depends on the combined effects of density, permeability, open-space structure, and recreational accessibility.
The particularly high stress observed in mahalla types contrasts with the more favorable distribution in microdistrict types M2a and M2b, supporting a morphotype-specific approach to densification regulation.
Table 3.
Priority planning measures by morphotype
| Morphotype | Priority measure |
|---|---|
| M1a | Develop local public and recreational spaces and improve pedestrian connectivity |
| M1b | Limit uncontrolled densification and preserve internal open spaces |
| M2a | Preserve courtyards and green areas and control new infill development |
| M2b | Compensate densification through landscape improvements and maintain pedestrian connections |
| M3 | Improve site permeability and the quality of courtyard spaces |
| M4 | Integrate residential complexes into the surrounding urban fabric and ensure recreational accessibility |
These priorities are consistent with approaches that link urban environmental quality to accessibility, connectivity, and the organization of public space [10].
Conclusion
The integrated assessment of 983 residential units in Tashkent revealed substantial differences in spatial and environmental stress among morphotypes. High and critical stress affected 48.0 % of the total sample, with the highest shares in transformed mahalla development M1b (74.8 %) and traditional mahalla development M1a (64.8 %), and the lowest in microdistrict types M2a (16.8 %) and M2b (14.3 %).
The results show that spatial and environmental stress is not linearly determined by development density, but emerges from the combined effects of morphometric characteristics, street-network connectivity, and recreational accessibility. Densification policies should therefore reflect the initial morphological structure of residential fabric: preserving open space and local connectivity in mahallas, protecting spatial reserves in microdistricts, and improving permeability and integration in contemporary mid- and high-rise developments. The proposed approach can be used as a preliminary diagnostic tool to identify areas where further densification requires restrictions or compensatory measures.
References