Hydrological assessment and management prospects of the Amudarya delta water bodies using GIS technologies
УДК 556.53:556.166:574.5
Abstract
The reduction in Amudarya River discharge over recent decades has caused severe degradation of the delta’s water bodies, threatening regional water security and ecological balance. The objective of this study was to conduct a GIS-based hydrological assessment of the Mezhdurechye Reservoir, Muynoq Bay, and Balikchi Bay in the Amudarya Delta, and to develop a mathematical model of their water balance for improving the water supply regime. Morphometric characteristics (area, volume, mean and maximum depth) were determined through field surveys using a Garmin eTrex 32x GPS navigator, Leica NA332 optical level, and VEGA TEO-20B/5B electronic theodolite, combined with ArcGIS 10.8 spatial analysis by the isobath method. Multi-year discharge data from the Kyzyldzhar hydrometric station (1965–2022) were analysed, and a differential water balance model was developed in the Visual C# environment, applying a monthly discretisation time step and verified against three characteristic years (wet — 2010; average — 2019; dry — 2001). The results show that the current storage capacity of the Mezhdurechye Reservoir is 13 % below its design value due to siltation, while bay areas have decreased by 14–23 %. Long-term discharge analysis confirms extreme flow regime instability (Cv = 1.08), with water reaching the delta basins in dry years being 166 times lower than in wet years. Zooplankton surveys recorded 27 species, markedly fewer than the 36 species documented in 1968–1983, indicating ongoing ecological degradation. The GIS-based framework developed in this study provides a scientifically grounded tool for water resource management in the Amudarya Delta.
Аннотация
Сокращение стока реки Амударья за последние десятилетия привело к серьезной деградации водных объектов дельты, угрожая региональной водной безопасности и экологическому балансу. Целью данного исследования было проведение гидрологической оценки Междуречьего водохранилища, залива Муйнок и залива Баликчи в дельте Амударьи с использованием ГИС-технологий, а также разработка математической модели их водного баланса для улучшения режима водоснабжения. Морфометрические характеристики (площадь, объем, средняя и максимальная глубина) определялись в ходе полевых исследований с использованием GPS-навигатора Garmin eTrex 32x, оптического нивелира Leica NA332 и электронного теодолита VEGA TEO-20B/5B в сочетании с пространственным анализом ArcGIS 10.8 методом изобат. Проанализированы многолетние данные о расходе воды с Кызылджарской гидрологической станции (1965–2022 гг.), разработана дифференциальная модель водного баланса в среде Visual C# с применением месячного шага дискретизации по времени, проверенная на трех характерных годах (влажный — 2010; средний — 2019; засушливый — 2001). Результаты показывают, что текущая емкость водохранилища Междуречь на 13 % ниже проектной из-за заиления, а площадь залива уменьшилась на 14–23 %. Долгосрочный анализ расхода подтверждает крайнюю нестабильность режима стока (Cv = 1,08), при этом объем воды, достигающей дельтовых бассейнов в засушливые годы, в 166 раз ниже, чем во влажные. В ходе исследований зоопланктона было зарегистрировано 27 видов, что значительно меньше, чем 36 видов, задокументированных в 1968–1983 годах, что указывает на продолжающуюся экологическую деградацию. Разработанная в данном исследовании ГИС-система представляет собой научно обоснованный инструмент для управления водными ресурсами в дельте реки Амударья.
Keywords: Amudarya delta; GIS technologies; water balance; morphometry; Mezhdurechye Reservoir; Muynoq Bay; Balikchi Bay; zooplankton; ArcGIS 10.8; hydrological modelling.
Ключевые слова: дельта реки Амударья; ГИС-технологии; водный баланс; морфометрия; Междуречье водохранилище; залив Муйнок; залив Баликчи; зоопланктон; ArcGIS 10.8; гидрологическое моделирование.
1. Introduction
The Amudarya Delta is located in the Republic of Karakalpakstan, Uzbekistan, and holds strategic significance for the region’s water resources and ecological balance. Historically, according to data from 1963–1965, the total area of the delta was 8,990 km², with lake systems such as Muynoq, Balikchi, Dumalak, Zhiltirbas, and Sudochye directly connected to the Aral Sea [1]. Over recent decades, a dramatic reduction in Amudarya discharge downstream of the Takhiatash hydraulic node has caused the delta lake area to shrink by more than half [2].
The decline in Amudarya discharge has had severe negative impacts not only on the region’s fisheries and agricultural potential, but also on its ecosystems. Whereas the delta’s lake systems covered more than 600 km² in the 1960s, this figure has decreased several-fold to date [3]. Between 2000 and 2003, a complex of engineering and organisational measures for restoring the ecological regime of the southern Aral region was developed under the NATO Science for Peace project [4]. Against this backdrop, there is an urgent need to monitor water bodies using GIS technologies and remote sensing, to conduct hydrological analyses, and to develop effective water management strategies [5].
The objective of this study is to evaluate the current hydrological status of the Amudarya Delta water bodies using GIS technologies, to model their water balance under different hydrological conditions, and to develop science-based recommendations for improving their water supply regime. To achieve this objective, the following tasks were addressed:
- to determine the current morphometric parameters (area, volume, mean and maximum depth) of the Mezhdurechye Reservoir, Muynoq Bay, and Balikchi Bay through GPS-based field surveys and ArcGIS 10.8 spatial analysis, and to compare them with design values;
- to analyse long-term discharge data from the Kyzyldzhar hydrometric station (1965–2022) and identify trends in the water supply regime of the delta;
- to develop and verify a differential mathematical model of the water balance of the delta water bodies under characteristic years of different water availability (wet, average, dry);
- to assess the current hydrobiological status of the water bodies through zooplankton composition analysis and to evaluate its relationship with the hydrological regime.
2. Materials and methods
2.1. Study area and field equipment
The study objects are the Mezhdurechye Reservoir, Muynoq Bay, and Balikchi (Sarbas) Bay, located in the Muynoq District of the Republic of Karakalpakstan. Field surveys were conducted during the 2022–2023 vegetation seasons, covering both low-water and high-water periods. The equipment and software used in this study are summarised in Table 1.
Table 1.
Field equipment and software used in the study
| # | Equipment / Software | Model | Purpose | Accuracy / Spec. |
|---|---|---|---|---|
| 1 | GPS navigator | Garmin eTrex 32x | Coordinate determination of survey points | ±3 m horizontal (WGS-84) |
| 2 | Optical level | Leica NA332 | Absolute elevation measurement along profiles | ±2.0 mm/km double-run |
| 3 | Electronic theodolite | VEGA TEO-20B/5B | Angular and elevation control measurements | 20″ angular accuracy |
| 4 | Sounding rod | Standard graduated | Manual bathymetric depth measurement | ±0.01 m |
| 5 | Plankton net | No. 76 | Zooplankton sample collection | Mesh 64 μm |
| 6 | Light microscope | Micmed-6 | Species identification and enumeration | ×100–400 |
| 7 | Counting chamber | Bogorov chamber | Quantitative zooplankton counting | Volume 1 ml |
| 8 | GIS software | ArcGIS 10.8 (ESRI) | DEM, isobath analysis, morphometric calc. | TIN/IDW interpolation [6] |
| 9 | Water balance model | Visual C# (.NET) | Differential water balance computation | Δt = 1 month |
| 10 | Statistics | MS Excel 2019 | Hydrological statistics (Cv, Cs) | Kritsky–Menkel distribution |
2.2. Bathymetric survey and morphometric analysis
Prior to field surveys, each water body was divided into cross-sectional profiles oriented perpendicular to the main longitudinal axis. For the Mezhdurechye Reservoir, 8 profiles were established at approximately 500 m intervals; for Muynoq Bay, 7 profiles at 600 m intervals; and for Balikchi Bay, 6 profiles at 400 m intervals. Profile endpoints were marked and their coordinates recorded using the Garmin eTrex 32x GPS navigator. Along each profile, depth measurements were taken at 50–100 m intervals using a graduated sounding rod, yielding (x, y, depth) triplets for the entire water body. In total, 312 sounding points were collected: 128 for Mezhdurechye, 104 for Muynoq Bay, and 80 for Balikchi Bay.
Absolute elevation of the water surface was measured at each water body using the Leica NA332 optical level, referenced to the Baltic Height System (BHS-1977). All depth readings were converted to absolute bed elevation: Znea = Zsuʳᶠaᶜe − d, where d is the measured water depth. All (x, y, Znea) data were imported into ArcGIS 10.8 and a Digital Elevation Model (DEM) was constructed using the Triangulated Irregular Network (TIN) method at 10 m × 10 m resolution [7, 8]. Isobath contour lines were generated at 0.5 m intervals, and area–elevation and volume–elevation curves were derived using the Surface Volume tool in ArcGIS Spatial Analyst [9].
Volume was computed by the isobath (prismatoid) method:
| ; | (1) |
where V is the reservoir volume (m³), Wi is the area enclosed by isobath i (m²), and hi is the elevation difference between adjacent isobaths (m). Mean depth was derived as Hmean = V / W.
2.3. Hydrological data analysis
Multi-year discharge data (1965–2022) were obtained from the Kyzyldzhar hydrometric station archives [10]. Statistical parameters — long-term mean, coefficient of variation (Cv), and asymmetry coefficient (Cs) — were calculated by standard methods, and flow provision curves (3 %, 50 %, 96 %) were constructed using the Kritsky–Menkel distribution.
2.4. Water balance model
A differential water balance model was developed in Visual C#, based on a system of three coupled differential equations for each water body (Mezhdurechye — i=1, Muynoq Bay — i=2, Balikchi Bay — i=3):
| ; | (2) |
where:
- — water volume of the i-th water body (m³);
- — inflow discharge to the i-th water body (m³/month);
- — outflow discharge from the i-th water body (m³/month);
- — evaporation losses from the water surface of the i-th water body (m³/month);
- — filtration (seepage) losses from the i-th water body (m³/month).
The three equations are coupled through the shared allocation of the total Amudarya discharge arriving at the Kyzyldzhar station among the canal network (Glavmyaso, Marinkinuzak and others) that supplies the three basins. The model was solved using the finite-difference (Euler forward) method with a monthly time step (Δt = 1 month). Initial conditions were set as field-measured water volumes at the start of each characteristic year (Table 2). Canal transmission losses were set at 25% of inflow, based on long-term observational data [1]. Monthly evaporation losses were computed as , where is the monthly evaporation layer (mm/month) from the Muynoq meteorological station, and is the current water surface area. Filtration losses were estimated using Darcy’s law with a specific seepage rate mm/day [2, 11].
Table 2.
Initial conditions for water balance modelling (field-measured volumes, mln. m³)
| Characteristic year | Water availability | Flow provision (%) | V₀ Mezhdurechye | V₀ Muynoq Bay | V₀ Balikchi Bay |
|---|---|---|---|---|---|
| 2010 | Wet | 3% | 18.4 | 24.7 | 6.3 |
| 2019 | Average | 50% | 12.6 | 17.2 | 4.1 |
| 2001 | Dry | 96% | 5.8 | 8.4 | 1.7 |
Model calibration was performed against the average year (2019) by minimising RMSE between computed and observed monthly volumes. The calibrated canal diversion coefficient was α = 0.68 and seepage rate f = 0.5 mm/day. The model was then validated independently against 2010 and 2001 data (Table 3).
Table 3.
Model validation metrics by water body
| Metric | Mezhdurechye | Muynoq Bay | Balikchi Bay |
|---|---|---|---|
| RMSE (mln. m³) | 0.74 | 1.12 | 0.38 |
| MAE (mln. m³) | 0.61 | 0.94 | 0.31 |
| Nash–Sutcliffe Efficiency (NSE) | 0.87 | 0.83 | 0.89 |
NSE values of 0.83–0.89 indicate good to very good model performance, confirming reliable reproduction of seasonal water storage dynamics [11, 12].
2.5. Hydrobiological sampling
Zooplankton sampling was carried out at fixed stations during the 2022–2023 field seasons using a plankton net No. 76 (mesh 64 μm). A total of 32 samples were collected and fixed with 4 % formaldehyde. Laboratory analysis was performed under a Micmed-6 light microscope using a Bogorov counting chamber. Taxonomic identification followed standard keys for Rotifera, Cladocera, and Copepoda [13, 14]. Abundance (ind./m³) and biomass (mg/m³) were calculated per station and water body.
3. Results and discussion
3.1. Morphometric characteristics: field measurements vs. design values
GPS field surveys and ArcGIS 10.8 isobath analysis yielded current morphometric parameters for all three water bodies. Table 4 compares these against 1975 design values from Uzgiprovodkhoz [15].
Table 4.
Comparison of design and field-measured morphometric parameters (2022–2023)
| Parameter | Design (1975) | Current (2022–23) | Change (%) |
|---|---|---|---|
| MEZHDURECHYE RESERVOIR | |||
| Surface area (ha) at H = 57.0 m | 21 400 | 16 411 | −23.4% |
| Total volume (mln. m³) | 230.0 | 199.9 | −13.1% |
| Maximum depth (m) | 6–7 | 5–6 | ∼−17% |
| Mean depth (m) | — | 1.74 | — |
| MUYNOQ BAY | |||
| Surface area (ha) | 15 034 | 12 529 | −16.7% |
| Total volume (mln. m³) | 210.0 | 184.97 | −11.9% |
| Maximum depth (m) | 4.2 | 4.0–4.2 | −0.5% |
| Mean depth (m) | — | 1.48 | — |
| BALIKCHI (SARBAS) BAY | |||
| Surface area (ha) | 7 304 | 6 243 | −14.5% |
| Total volume (mln. m³) | 151.4 | 124.91 | −17.5% |
| Maximum depth (m) | 4.0 | 3.5–4.0 | −3.5% |
| Mean depth (m) | — | 2.0 | — |
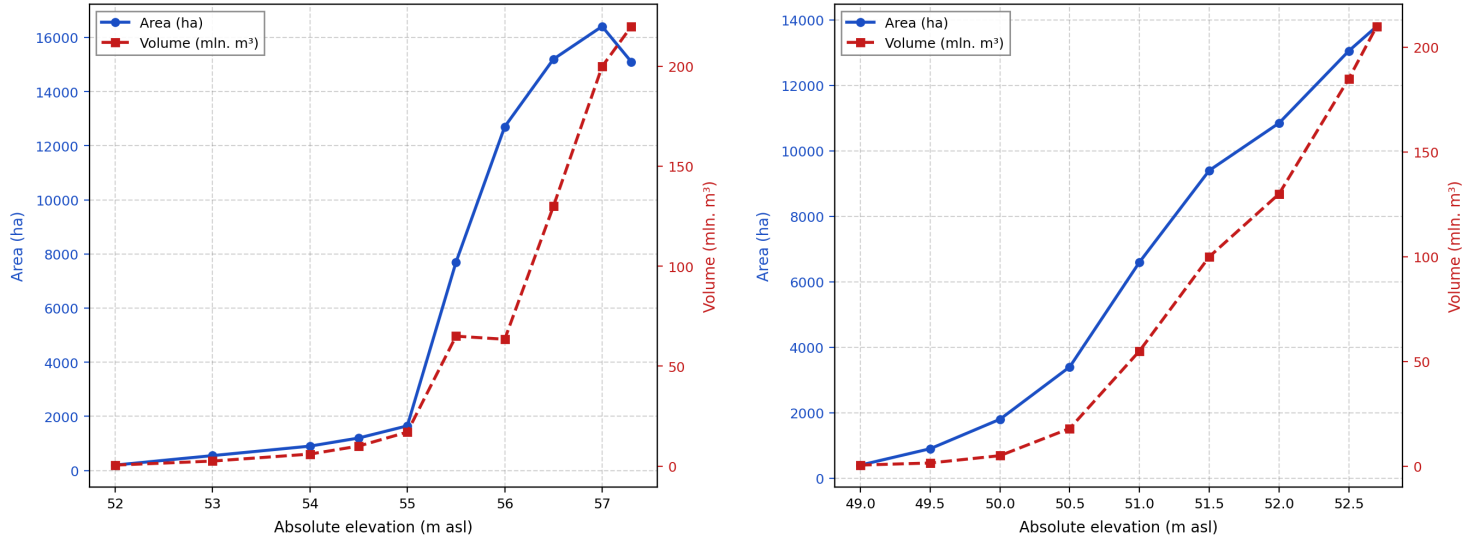
Cross-validation of ArcGIS-derived mean depths against field sounding means confirmed the reliability of the spatial analysis: relative errors did not exceed 2.7 % for any water body [8]. The greatest proportional volume loss was recorded at Balikchi Bay (−17.5 %), reflecting its position at the distal end of the delta supply system. The area–elevation and volume–elevation (bathymetric) curves derived for the Mezhdurechye Reservoir and Muynoq Bay are shown in Figure 1; these curves served as the primary tool for extracting morphometric parameters and as direct input to the water balance model.
3.2. Long-term Amudarya discharge trends (1965–2022)
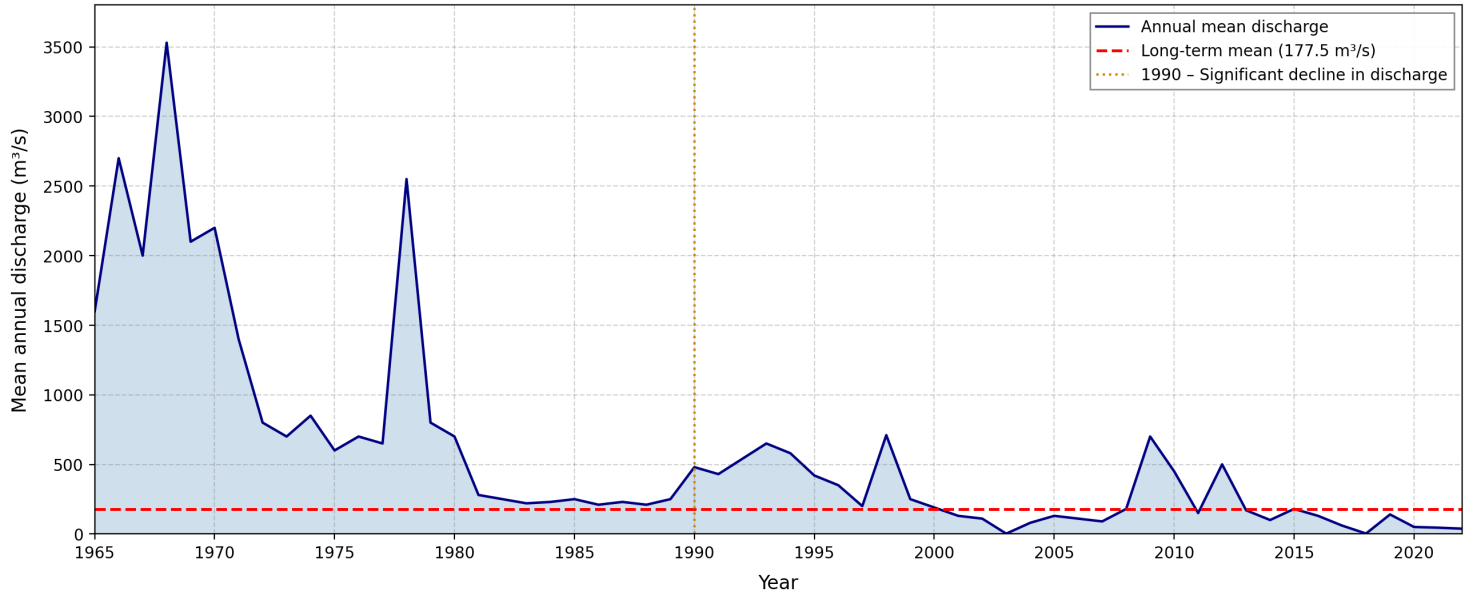
Analysis of 58-year discharge records from the Kyzyldzhar hydrometric station reveals a sharp declining trend (Figure 2). The maximum monthly mean discharge in 1969 was 3,530 m³/s; by 2001 it had fallen to 2.1 m³/s. Long-term mean discharge: 177.48 m³/s. Flow provision parameters: 3 % provision — 714.1 m³/s (1980); 50 % provision — 116.9 m³/s (2000); 96 % provision — 2.83 m³/s (2021). The coefficient of variation Cv = 1.08 and asymmetry coefficient Cs = 1.79 confirm extreme flow regime instability and high risk of prolonged drought [7, 16]. This sharp declining trend beginning in the mid-1990s is consistent with satellite-based findings on delta lake shrinkage [3, 17].
3.3. Water balance modelling results
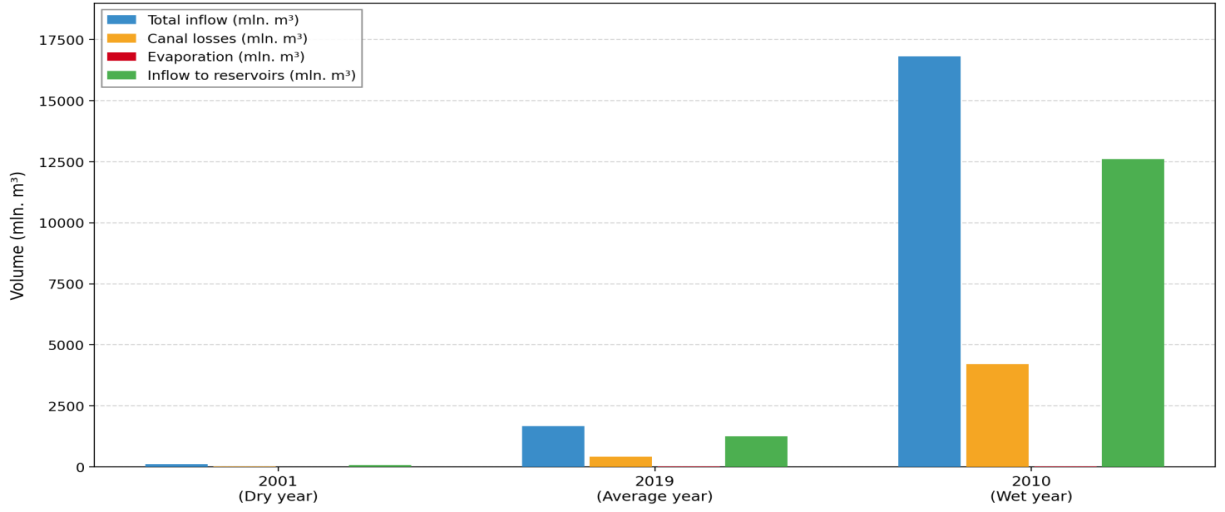
Water balance modelling results for the three characteristic years are presented in Table 5 [12, 18].
Table 5.
Water balance of the delta system in different hydrological years (modelling results)
| Parameter | Wet year (2010) | Average year (2019) | Dry year (2001) |
|---|---|---|---|
| Total inflow (mln. m³) | 16 817.7 | 1 674.4 | 100.89 |
| Canal losses (mln. m³) | 4 204.4 | 418.6 | 25.22 |
| Total evaporation (mln. m³) | 14.50 | 11.44 | 4.95 |
| Filtration (mln. m³) | 1.30 | 1.14 | 0.17 |
| Loss fraction (%) | 25.0% | 25.0% | 25.0% |
| Water reaching basins (mln. m³) | ∼12 600 | ∼1 244 | ∼70.5 |
In a dry year (2001) total water reaching the delta basins was only 100.89 mln. m³ — 166 times less than in the wet year (2010, 16 817.7 mln. m³). Model NSE = 0.83–0.89 confirms reliable performance across all validation years.
3.4. Hydrobiological results and statistical analysis
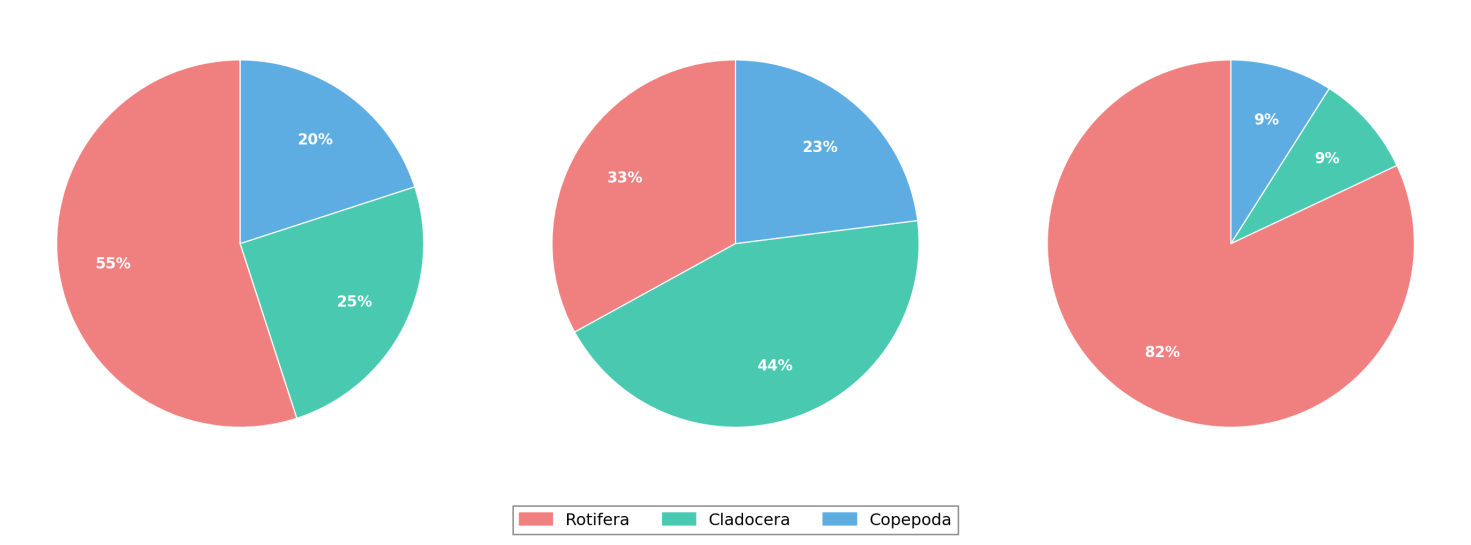
A total of 32 zooplankton samples were collected: 12 from Mezhdurechye Reservoir (4 stations × 3 dates), 12 from Muynoq Bay (4 stations × 3 dates), and 8 from Balikchi Bay (4 stations × 2 dates). Twenty-seven species were identified: 15 Rotifera (55.6 %), 6 Cladocera (22.2 %), 6 Copepoda (22.2 %). This is markedly fewer than the 36 species recorded in 1968–1983 [13, 14], indicating long-term ecological impoverishment.
Table 6.
Zooplankton species composition by water body (2022–2023)
| Taxonomic group | Total | Mezhdurechye | Muynoq Bay | Balikchi Bay |
|---|---|---|---|---|
| Rotifera | 15 | 13 | 11 | 8 |
| Cladocera | 6 | 5 | 4 | 3 |
| Copepoda | 6 | 6 | 5 | 4 |
| Total species | 27 | 24 | 20 | 15 |
Table 7.
Mean zooplankton abundance and biomass by water body (mean ± SD)
| Water body | n | Abundance (ind./m³) | SD | Biomass (mg/m³) | SD | Dominant group |
|---|---|---|---|---|---|---|
| Mezhdurechye | 12 | 4 820 | 1 340 | 312.4 | 87.6 | Rotifera (61%) |
| Muynoq Bay | 12 | 3 150 | 980 | 198.7 | 64.3 | Rotifera (58%) |
| Balikchi Bay | 8 | 1 740 | 620 | 94.3 | 31.8 | Copepoda (47%) |
Table 8.
Seasonal dynamics of zooplankton abundance (ind./m³, mean ± SD)
| Sampling period | Mezhdurechye | Muynoq Bay | Balikchi Bay |
|---|---|---|---|
| Spring (Apr–May) | 6 410 ± 1 120 | 4 380 ± 890 | 2 290 ± 540 |
| Summer (Jul–Aug) | 3 640 ± 980 | 2 110 ± 670 | 1 020 ± 310 |
| Autumn (Sep–Oct) | 4 410 ± 1 050 | 2 960 ± 720 | 1 910 ± 480 |
Summer values averaged 43–55 % below spring peaks, directly linked to seasonal minimum Amudarya inflow documented at Kyzyldzhar station. A positive relationship was found between total volume and all biological indicators: Pearson r = 0.97–0.99 across the three water bodies [19], confirming that hydrological status is the primary driver of zooplankton productivity in the delta [20].
4. Conclusions
1. GIS-based field surveys (Garmin eTrex 32x, Leica NA332, VEGA TEO-20B/5B) combined with TIN-based DEM construction and isobath-method volume computation in ArcGIS 10.8 [6, 8] showed that current morphometric parameters of the three water bodies deviate significantly from 1975 design values [15]: Mezhdurechye Reservoir −13.1 % volume, Muynoq Bay −11.9 %, Balikchi Bay −17.5 %. Cross-validation confirmed ArcGIS accuracy to within 2.7 %. Recommendation: systematic bathymetric re-surveys at 5-year intervals are required to monitor siltation and inform dredging operations.
2. Analysis of 58-year discharge records at the Kyzyldzhar station [10] yielded Cv = 1.08, Cs = 1.79, confirming extreme flow instability. Dry-year discharge (2.83 m³/s in 2021) was 252 times lower than wet-year discharge (714.1 m³/s in 1980) [2, 11]. Recommendation: a minimum ecological flow of ≥50 m³/s at the Kyzyldzhar station must be established as a regulatory threshold.
3. The Visual C# differential water balance model (3 coupled equations, Δt = 1 month, NSE = 0.83–0.89) [11, 12] demonstrated that water reaching the delta in a dry year (2001, 100.89 mln. m³) was 166 times less than in a wet year (2010). Recommendation: restoring design capacities of the Glavmyaso canal (44 m³/s) and Marinkinuzak canal (50 m³/s) would increase effective inflow by an estimated 25–30 % [21, 22].
4. Zooplankton surveys (32 samples, 27 species across 3 water bodies) confirmed direct biological response to hydrological decline: species richness fell from 36 (1968–1983) to 27 (2022–2023), a 25 % reduction [13, 14]. Abundance declined from 4 820 ind./m³ (Mezhdurechye) to 1 740 ind./m³ (Balikchi), Pearson r = 0.97–0.99 [19]. Recommendation: minimum inflow to maintain mineralisation below 2.0 g/l must be incorporated into water allocation plans.
5. The integrated GIS–hydrological framework developed in this study provides a replicable tool for monitoring and managing water resources in degraded arid-region delta systems [7, 9], consistent with the national policy framework for the Aral Sea region [23] and current scientific consensus on restoration potential of the southern Aral Sea basin [4, 5]. The framework can serve as an operational tool for annual water allocation planning by water management authorities of the Republic of Karakalpakstan [16, 17], while accounting for the influence of upstream anthropogenic water use and climatic change on future streamflow composition in the Amu Darya Basin [24]. Recommendation: the integrated GIS–hydrological assessment framework should be adopted as a standard monitoring and planning tool by the relevant water management authorities, with annual updates of morphometric and hydrological data.