Nitrate monitoring of vegetable and cucurbit products in Pop and Chust districts, Namangan region, Uzbekistan
УДК 614.31:635.1/.8
Abstract
This study evaluated the coverage, commodity composition, temporal dynamics, and organization of nitrate monitoring in vegetable and cucurbit products in Pop and Chust districts, Namangan Region, during 2022–2026. A retrospective dataset of 1,890 records covering eight principal commodities was analyzed. Field screening used a Greentest Eco 3F portable analyzer, with readings recorded as mg NO3 kg-¹. Thirty-one records contained unambiguous numerical results. For categories with n≥3, the mean, standard deviation, and Student-t 95 % confidence interval were calculated; n=2 categories were reported as observed ranges and n=1 categories as single values. Onion, carrot, and potato represented 78.8 % of all records. The highest screening readings occurred in selected dill, coriander, cabbage, and beetroot samples. Comparison with evidence from Uzbekistan and neighboring regions supports prioritizing leafy herbs and root crops, although differences in analytical methods, seasons, and sampling designs preclude direct quantitative equivalence. Because paired accredited-laboratory results were unavailable, portable readings cannot establish regulatory non-compliance. A reproducible prospective programme is proposed: weekly monitoring of leafy herbs during peak season, biweekly monitoring of cucurbits during harvest, monthly monitoring of root and other vegetables, at least 10 samples per district and commodity group per round, three replicate readings per sample, and accredited laboratory confirmation whenever the screening mean reaches 80 % of the applicable limit or exceeds it.
Аннотация
Цель исследования – оценить охват, товарную структуру, временную динамику и организацию мониторинга нитратов в овощной и бахчевой продукции Папского и Чустского районов Наманганской области в 2022–2026 гг. Ретроспективно проанализировано 1890 записей по восьми основным видам продукции. Полевой скрининг выполняли портативным анализатором Greentest Eco 3F с регистрацией результата в мг NO3/кг. Из первичного массива 31 запись содержала однозначно интерпретируемые числовые показания. Для категорий с n≥3 рассчитывали среднее, стандартное отклонение и 95 %-ный доверительный интервал Стьюдента; при n=2 приводили диапазон, при n=1 – единичное значение. Лук, морковь и картофель составили 78,8 % всех записей. Наиболее высокие скрининговые показания отмечены в отдельных пробах укропа, кориандра, капусты и столовой свёклы. Сопоставление с опубликованными для Узбекистана и соседних регионов данными подтверждает приоритет зеленных и корнеплодных культур, однако прямое количественное сравнение ограничено различиями методов, сезонов и схем отбора. Поскольку отсутствовали параллельные измерения аккредитованным лабораторным методом, результаты нельзя считать доказательством нормативного несоответствия. Предложена воспроизводимая схема дальнейшего мониторинга: еженедельный контроль зелени в сезон, контроль бахчевых каждые две недели, ежемесячный контроль корнеплодов и других овощей, не менее 10 проб на район и товарную группу за один раунд, три повторных измерения каждой пробы и обязательное лабораторное подтверждение значений, достигающих 80 % применимого предела или превышающих его.
Keywords: nitrate; vegetables; cucurbits; food safety; field screening; sanitary monitoring; Namangan Region.
Ключевые слова: нитраты; овощи; бахчевые культуры; безопасность пищевых продуктов; экспресс-контроль; санитарный мониторинг; Наманганская область.
Introduction
Food safety and sanitary control in Uzbekistan are governed by the Law of the Republic of Uzbekistan “On the Sanitary and Epidemiological Well-Being of the Population” and by national sanitary rules and hygienic regulations for food safety [1; 6].
Vegetables and cucurbit products are important sources of vitamins, minerals, and dietary fibre. However, excessive nitrogen fertilization or fertilizer application that does not follow recommended agricultural practices may promote nitrate accumulation in certain crops [3; 7; 9]. Nitrate concentrations vary with plant species, growth stage, light intensity, soil moisture and properties, fertilizer application rate, and harvest time.
International evidence shows that food safety requires continuous monitoring of chemical hazards and scientifically sound fertilizer management throughout production [2; 10]. Recent research also emphasizes that dietary nitrate should be interpreted in relation to its food source, exposure level, and broader dietary context [8]. Routine monitoring of vegetable and cucurbit products sold at retail outlets, production sites, and public institutions is therefore an important component of regional food-safety management.
This study aimed to assess the coverage, commodity composition, annual dynamics, available spatial metadata, and limitations of spatial analysis of nitrate monitoring in Pop and Chust districts from 2022 to 2026 and to summarize clearly documented rapid-screening results using descriptive statistics.
Materials and Methods
The investigation was a retrospective analysis of nitrate-monitoring records generated from January 2022 through the available part of 2026. The sampling frame comprised Pop City and Pop District, Chust City and Chust District, the Gurumsaroy area, farmers’ markets, retail outlets, preschool educational institutions, selected public institutions, and agricultural production sites in Namangan Region, Uzbekistan. Records covered potato, onion, carrot, cucumber, tomato, cabbage, melon, watermelon, beetroot, turnip, pumpkin, pepper, leafy vegetables, apple, and other products. The unit of analysis was one archived monitoring record. Eight commodities with sufficiently complete annual counts were retained for coverage analysis; all 31 records with an unambiguous numerical nitrate result and unit were retained for concentration summaries. Records lacking a readable value, product identity, or interpretable measurement unit were excluded from the concentration analysis but not silently recoded.
Field investigations were conducted on 24 June and 1, 2, and 15 July 2026 in the Sang village area of Pop District, Namangan Region, Uzbekistan, at 40°50′31.61″ N, 71°10′42.13″ E and 332 m above sea level. This location was included among the agricultural production sites represented in the monitoring archive. The coordinates and elevation identify the field-survey locality; they should not be interpreted as coordinates for every market, institution, or production record in the retrospective dataset. Commodity names and spelling variants were harmonized before analysis. Records were grouped by calendar year and commodity; absolute counts and percentage shares were calculated for the eight principal commodities. The 2026 dataset covered an incomplete calendar year and is marked “2026*”. Available site descriptions were standardized into district/city, market or retail, preschool/public institution, and production-site categories. Because the historical archive did not preserve a complete district-by-site-type cross-tabulation or coordinates for every record, unsupported spatial estimates and retrospective mapping were not performed.
Field screening was performed with a Greentest Eco 3F portable nitrate analyzer (Greentest, Hong Kong). For the historical measurements, an intact representative product was selected, visible surface contamination was removed, and the probe was inserted directly into edible tissue; the stabilized display value was transcribed in mg NO3 kg-¹. The commodity profile was selected in the device software before measurement, and its embedded threshold served only as a screening trigger. The archive did not consistently document probe depth and position, sample temperature, cleaning between samples, calibration checks, replicate readings, certified reference materials, or matrix-specific recovery. These omissions are reported because they prevent exact analytical replication and retrospective estimation of repeatability, uncertainty, and bias. A prospective replication protocol should standardize edible-tissue position and probe depth according to the manufacturer’s instructions, clean and dry the probe between samples, equilibrate samples to a common temperature, record the selected device profile and calibration status, obtain three readings at separate positions, and analyze a retained homogenized portion by a validated ion-selective, spectrophotometric, or ion-chromatographic method in an accredited laboratory.
Validation Status and Prospective Validation Protocol
No paired portable-analyzer and accredited-laboratory dataset was generated during the retrospective monitoring period. Consequently, correlation, systematic bias, repeatability, recovery, and matrix-specific measurement error cannot be calculated from the available archive without creating unsupported data. The Greentest Eco 3F values are therefore classified strictly as preliminary screening readings. A prospective validation study should include 10 – 15 samples spanning low, intermediate, and high nitrate concentrations and representing leafy herbs, root vegetables, fruit vegetables, and cucurbits. Each sample should receive three standardized portable readings and parallel analysis of a retained homogenized portion by a validated ion-selective, spectrophotometric, or ion-chromatographic method in an accredited laboratory. The analysis should report the correlation coefficient, mean paired bias with a 95 % interval, repeatability as coefficient of variation, and matrix-stratified error. Until that validation is completed, the device results must not be used to determine legal compliance or analyzer accuracy. Statistical analysis was descriptive and commodity-specific. For n≥3, the arithmetic mean, sample standard deviation (denominator n-1), and two-sided 95 % confidence interval were calculated as mean ± t0.975,n−1×SD/√n. For n=2, only minimum-maximum range was reported; for n=1, the observed value was reported without dispersion statistics. Formal normality testing was not used because category sizes of 1 – 6 provide little diagnostic power. Calculations were checked against the tabulated source values. No missing value was imputed, no outlier was deleted solely because of magnitude, and no prevalence of regulatory non-compliance was estimated. Screening values were interpreted against published commodity benchmarks only for prioritization; official decisions require a current legal limit and confirmatory laboratory result.
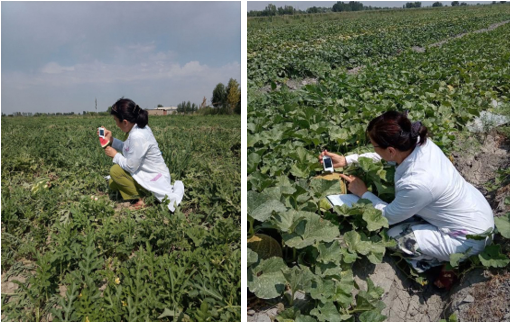
Source: Author’s photographs taken during field monitoring.
Results and Discussion
During data verification, records initially grouped for 2022 and 2023 were reorganized into separate annual datasets. Temporal patterns were therefore evaluated for 2022, 2023, 2024, 2025, and the available portion of 2026.
The monitoring-coverage results and descriptive statistics for the rapid-screening observations are presented below.
Table 1.
Monitoring coverage of eight major vegetable and cucurbit commodities, 2022–2026
| Commodity | 2022 | 2023 | 2024 | 2025 | 2026* | Total | Share (%) |
|---|---|---|---|---|---|---|---|
| Potato | 112 | 95 | 119 | 114 | 45 | 485 | 25.7 |
| Onion | 110 | 110 | 129 | 122 | 47 | 518 | 27.4 |
| Carrot | 95 | 113 | 119 | 116 | 43 | 486 | 25.7 |
| Cucumber | 5 | 16 | 24 | 22 | 6 | 73 | 3.9 |
| Tomato | 13 | 22 | 28 | 26 | 8 | 97 | 5.1 |
| Melon | 10 | 5 | 9 | 13 | 11 | 48 | 2.5 |
| Watermelon | 12 | 6 | 10 | 14 | 14 | 56 | 3.0 |
| Cabbage | 7 | 15 | 48 | 41 | 16 | 127 | 6.7 |
| Total | 364 | 382 | 486 | 468 | 190 | 1890 | 100.0 |
Source: Compiled by the author from primary nitrate monitoring records. Note: 2026* represents an incomplete calendar year.
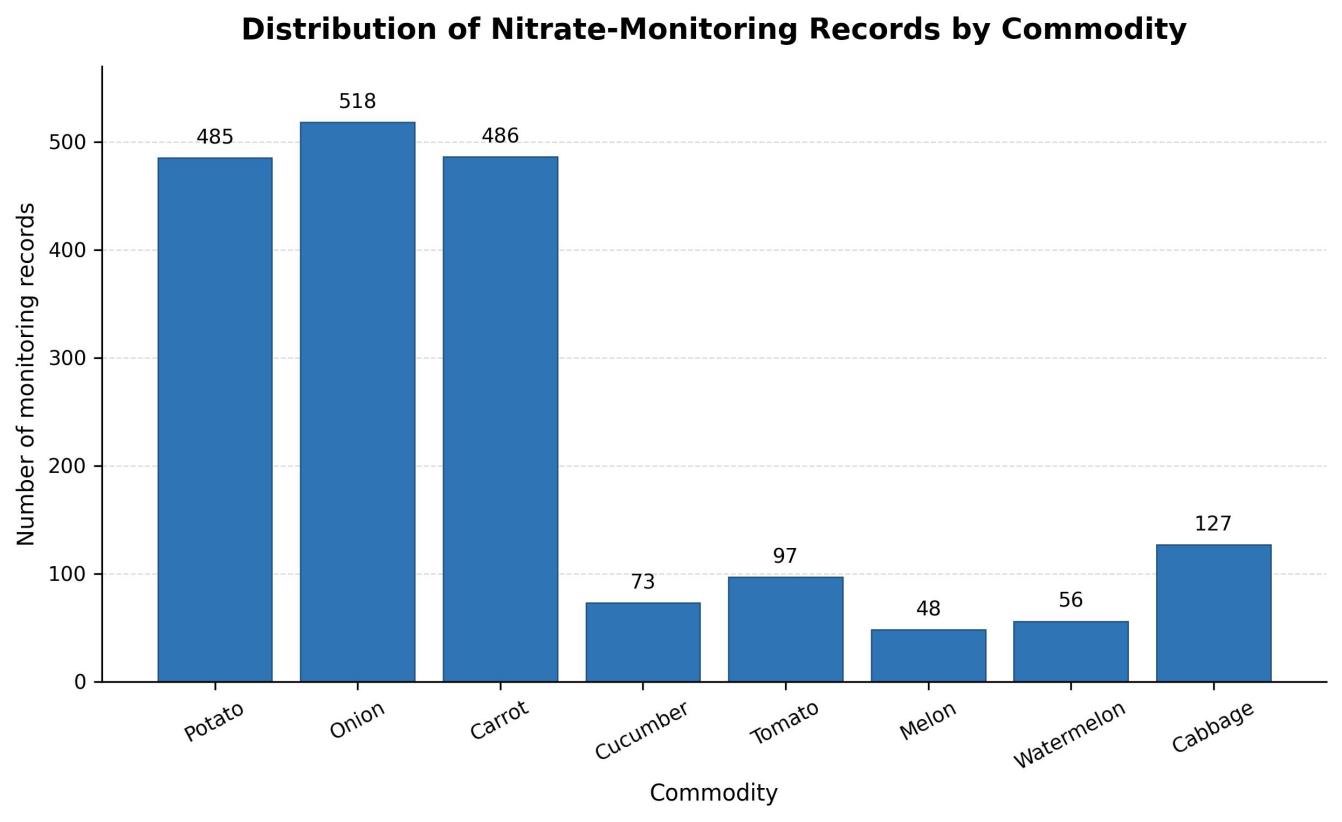
A total of 1,890 monitoring records were compiled for the eight selected commodities. Onion accounted for the largest share (518 records; 27.4 %), followed by carrot (486; 25.7 %) and potato (485; 25.7 %). Together, these three commodities represented 78.8 % of all records, probably reflecting their widespread year-round consumption and continuous availability in commercial markets.
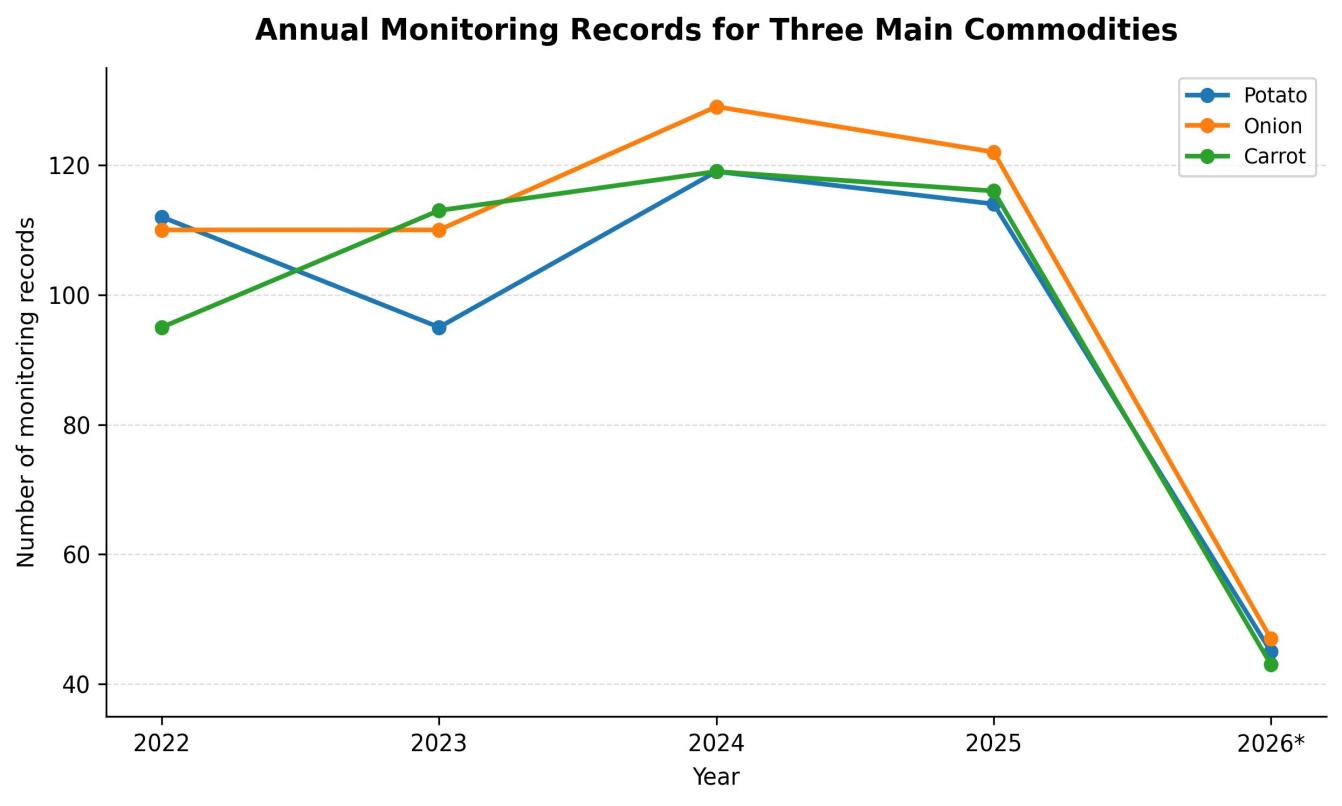
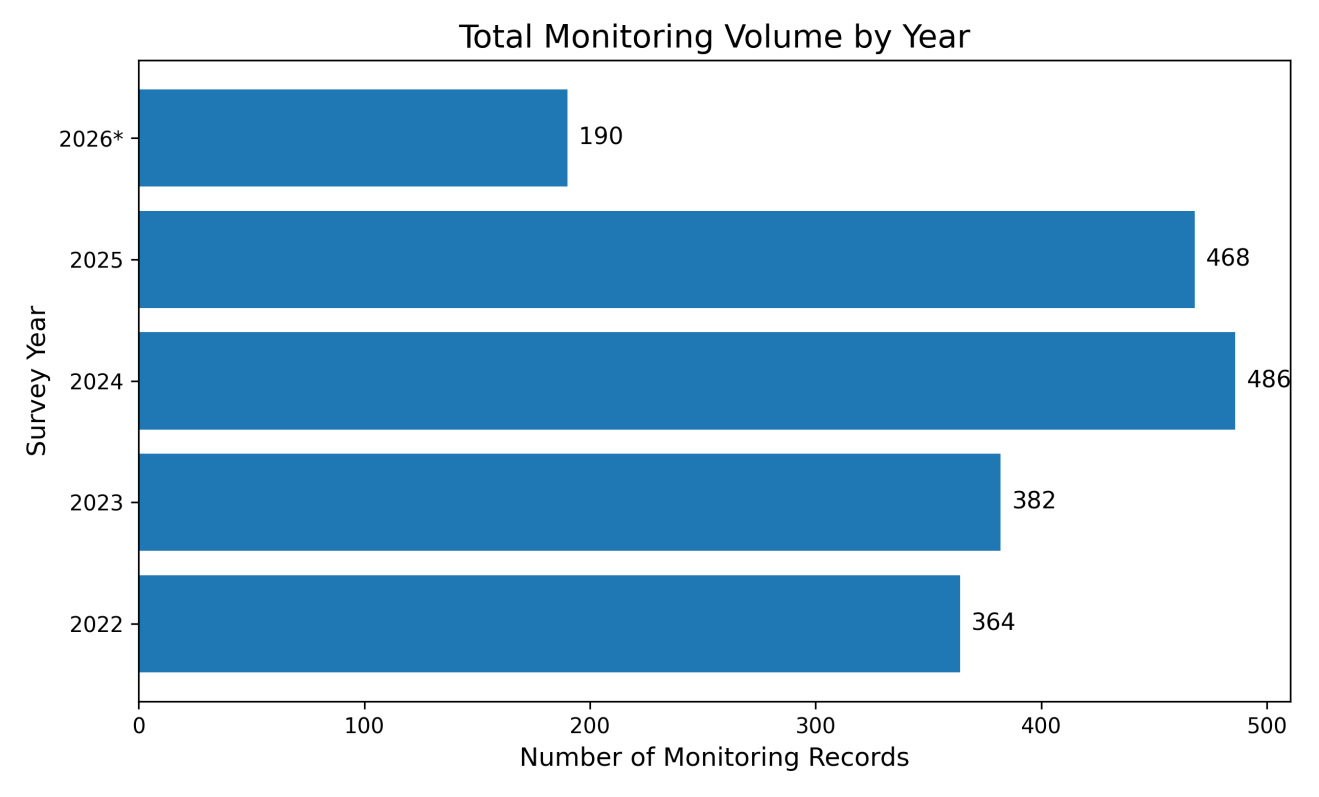
Annual monitoring coverage was highest in 2024 (486 records), followed by 2025 (468), 2023 (382), and 2022 (364). The 190 records available for 2026 cover only part of the calendar year; therefore, the lower total for 2026 should not be interpreted as a decline in monitoring activity
Source: Prepared by the author based on primary monitoring records
Source: Prepared by the author based on primary monitoring records
Source: Prepared by the author based on primary monitoring records.
Annual patterns for the principal commodities were broadly similar. In 2024, onion had the largest number of records (129), while potato and carrot each had 119. Although the number of records decreased slightly in 2025, overall monitoring coverage remained high.
Among the remaining commodities, cabbage represented 6.7 % of all records, followed by tomato (5.1 %), cucumber (3.9 %), watermelon (3.0 %), and melon (2.5 %). The smaller numbers for melon and watermelon probably reflect their seasonal production and market availability.
Table 2.
Descriptive summary of rapid nitrate-screening readings and screening comparison with historical reference levels published in SanPiN 2.3.2.560-96
| Commodity | n | Descriptive result (mg kg⁻¹) | 95% CI for mean | Historical reference level in SanPiN 2.3.2.560-96 (mg kg⁻¹) | Screening comparison |
|---|---|---|---|---|---|
| Onion | 4 | Mean 67.6; SD 25.6 | 26.9-108.3 | 80 | Mean below; 95% CI crosses the reference level |
| Dill | 2 | Range 2010-2105 | Not estimated | 2000 open field; 3000 protected cultivation | 2010-2105: above open-field, below protected-cultivation level |
| Coriander | 2 | Range 2010-2154 | Not estimated | 2000 open field; 3000 protected cultivation* | 2010-2154: above open-field, below protected-cultivation level* |
| Tomato | 2 | Range 17-174 | Not estimated | 150 open field; 300 protected cultivation | 167-174: above open-field, below protected-cultivation level |
| Cabbage | 2 | Range 2105-2204 | Not estimated | 900 early; 500 late | 2105-2204: above both seasonal levels |
| Potato | 2 | Range 271-707 | Not estimated | 250 | 271-707: above the reference level |
| Cucumber | 3 | Mean 93.0; SD 72.5 | 0–273.1† | 150 open field; 400 protected cultivation | Mean below; 95% CI crosses the open-field level |
| Melon | 6 | Mean 160.7; SD 121.1 | 33.6-287.8 | 90 | Mean and observed maximum above the reference level |
| Muskmelon | 3 | Mean 196.2; SD 145.3 | 0–557.2† | 90 | Mean and observed maximum above the reference level |
| Apple | 1 | Single value 3.49 | Not estimated | 60 | Single reading below the reference level |
| Carrot | 2 | Range 113-142 | Not estimated | 400 early; 250 late | 113-142: below both seasonal levels |
| Beetroot | 1 | Single value 2560 | Not estimated | 1400 | Single reading above the reference level |
| Bell pepper | 1 | Single value 349 | Not estimated | 200 open field; 400 protected cultivation | 349: above open-field, below protected-cultivation level |
Note: The numerical values in this table are historical screening comparators taken from Table 2 of SanPiN 2.3.2.560 – 96: potato 250; early/late carrot 400/250; open/protected tomato 150/300; open/protected cucumber 150/400; beetroot 1400; onion 80; leafy vegetables 2000/3000; melon 90; apple 60; early/late cabbage 900/500; and open/protected sweet pepper 200/400 mg NO3 kg-¹. Commodity-specific numerical maximum permissible levels from Uzbekistan SanPiN No. 0079 – 24 were not available in the retrospective source materials and could not be verified from the study archive; therefore, no value in this table is presented as a current Uzbekistan legal limit. *Coriander was not listed separately in the photographed historical table and was provisionally grouped with leafy herbs under the ‘and others’ wording. Greentest readings were not confirmed by an accredited laboratory, so the comparisons are used solely to prioritize confirmatory sampling and cannot establish legal non-compliance. †Because nitrate concentrations cannot be negative, negative lower confidence bounds produced by the small-sample normal-theory calculation are displayed as zero; the intervals remain highly uncertain.
The revised analysis avoids means and standard deviations for categories with n<3. For n≥3, uncertainty was substantial: the 95 % confidence intervals were wide, especially for cucumber and muskmelon. The highest individual screening readings occurred in dill, coriander, cabbage, and beetroot. Because cultivation system, harvest timing, and confirmatory laboratory results were not consistently recorded, the comparator column supports risk prioritization only.
These findings require cautious interpretation because several commodity categories contained few observations, the records were retrospective, and confirmatory laboratory analyses were unavailable. The results therefore cannot be generalized to all vegetable and cucurbit products in the study area.
Regional and Hygienic Assessment
The programme included Pop City and Pop District, Chust City and Chust District, the Gurumsaroy farmers’ market, preschool institutions, public institutions, and agricultural production sites. However, the archived aggregate dataset did not retain a complete district-by-site-type cross-tabulation for all 1,890 records. A retrospective map or numerical district comparison would therefore create unsupported precision. Future records should capture coordinates and site type so that district-specific rates, confidence intervals, and maps can be produced. The only complete georeferenced field-survey record is presented in Table 4; it documents the Sang village production-field locality and the 2026 survey dates without implying coordinates for other archived records.
Although a portable nitrate analyzer is practical for rapid field screening, its readings should not be treated as evidence of official hygienic compliance. Results should be assessed against the applicable commodity-specific limits, and readings near or above those limits should be confirmed using a standardized analytical method in an accredited laboratory.
For reliable comparison and interpretation, each measurement record should include the sample identification code, commodity and cultivar, sampling date and location, site type, analyzer model, calibration date, number of replicate measurements, mean value, measurement unit, and applicable regulatory limit.
Table 3.
Minimum data fields recommended for standardized nitrate-monitoring records
| Required Data Field | Scientific and Practical Significance |
|---|---|
| Sample identification code, commodity type, and cultivar | Enables accurate sample identification and facilitates repeat verification. |
| Sampling date, location, and type of sampling site | Allows the assessment of seasonal and spatial variation. |
| Analyzer model and calibration date | Improves the evaluation of the metrological reliability of measurements. |
| At least three replicate measurements | Allows calculation of the mean value and measures of variability. |
| Measurement unit and applicable regulatory limit | Required for assessing hygienic compliance according to commodity-specific standards. |
| Confirmatory laboratory method | Provides definitive verification of screening results and supports regulatory decisions. |
Table 4.
Available georeferenced field-survey locality in the retrospective archive
| Recorded field | Recorded value |
|---|---|
| District | Pop District |
| Locality | Sang village |
| Site type | Agricultural production field |
| Survey dates | 24 June; 1, 2 and 15 July 2026 |
| Coordinates | 40°50′31.61″ N; 71°10′42.13″ E |
| Elevation | 332 m a.s.l. |
Note: This was the only complete coordinate-and-elevation record available for the added 2026 field survey. Comparable georeferenced records for Chust District and for every market or institution were not available; therefore, a retrospective district-level map or statistical spatial comparison was not produced.
Table 5.
Proposed stratification of future nitrate monitoring by district and site type
| Stratum | Routine frequency | Minimum samples per monitoring round | Required spatial record |
|---|---|---|---|
| Leafy herbs at markets/retail | Weekly in peak season | ≥10 per district | District, market/outlet, coordinates |
| Root crops | Monthly | ≥10 per district | District, producer/vendor, coordinates |
| Cucurbits | Every 2 weeks in harvest season | ≥10 per district | District, field/market, coordinates |
| Other vegetables | Monthly | ≥10 per district | District, site type, coordinates |
| Preschool/public institutions | Monthly; immediate follow-up after trigger | ≥5 per institution type per district | Institution code and coordinates |
| Production fields | At pre-harvest and market entry | ≥5 fields per major commodity per district | Field code, cultivar, cultivation system, coordinates |
Note: These targets are operational recommendations for balanced surveillance, not a claim that the retrospective dataset met them.
Interpretation of Findings
Operational Response Algorithm
1) Collect the minimum stratum-specific sample; 2) obtain three portable readings from standardized edible-tissue positions; 3) if the mean is below 80 % of the applicable comparator, record as routine screening; 4) if the mean is 80–100 % of the comparator, repeat sampling from the same lot and schedule laboratory confirmation; 5) if the mean exceeds the comparator, retain a traceable confirmatory sample and submit it promptly to an accredited laboratory; 6) base any regulatory decision only on the validated laboratory result; 7) after confirmation, intensify sampling at the same supplier/site and review fertilizer, irrigation, cultivar, and harvest records.
The findings indicate that nitrate monitoring in Pop and Chust districts has operated as a multiyear surveillance programme covering diverse sampling locations. The predominance of records for onion, carrot, and potato probably reflects their stable year-round availability and high consumption.
Nitrate accumulation depends on crop species, nitrogen source and rate, light intensity, soil moisture, cultivar, and harvest timing [3-5; 7; 9]. Leafy herbs can accumulate more nitrate because nitrate reduction is constrained under low light and when nitrogen supply exceeds immediate growth demand. High dill and coriander readings may therefore reflect fertilizer timing, protected cultivation, shading, irrigation regime, cultivar, or time of harvest; these explanations are plausible mechanisms, not causal findings, because the historical records lacked agronomic covariates. Cabbage and beetroot are also recognized accumulator crops, making them appropriate targets for intensified sampling. Risk reduction should emphasize soil-test-based nitrogen plans, split fertilizer applications, avoidance of excessive late nitrogen, adequate light and balanced irrigation, and harvest timing appropriate to the crop.
Portable nitrate analyzers offer a rapid and practical approach to field and market screening, but readings may be affected by sample temperature, moisture content, tissue characteristics, probe placement, and calibration status. Accordingly, readings near or above applicable limits should not be considered conclusive evidence of non-compliance unless confirmed by a standardized laboratory method.
Monitoring coverage and hygienic compliance are distinct outcomes. A large number of records indicates surveillance intensity, not the proportion of compliant or non-compliant products. A defensible compliance assessment requires commodity-specific regulatory limits and confirmation by an accredited laboratory.
Comparison with evidence from Uzbekistan and neighboring regions strengthens—but also qualifies—the interpretation. Normakhmatov and Abdurayimov [11] summarized nitrate risks in Uzbek fruit and vegetable production and identified dill, beetroot, radish, and turnip as crops prone to accumulation; they also emphasized nitrogen management and soil monitoring. The elevated dill and beetroot screening readings in the present dataset are directionally consistent with that national assessment. However, their article was primarily a normative and literature-based analysis rather than a field dataset, so it cannot be used as an independent numerical validation of the present measurements.
A regional laboratory study in Uzhgorod used homogenized samples and an ion-selective laboratory method, with 25 samples per vegetable and explicit seasonal sampling [12]. It reported more frequent exceedances in early-season cucumbers, carrots, tomatoes, peppers, and cabbage. By contrast, the present study found the strongest screening signals in herbs, cabbage, and beetroot, while cucumber had a lower mean with a wide confidence interval. The difference may reflect season, cultivation system, sample composition, and analytical method rather than a true geographic contrast. An Iranian study using laboratory measurements likewise found marked variation among vegetable types and between fresh and cooked products [13], supporting the need to record matrix, season, and processing state. Published Uzbek field datasets with paired portable and reference laboratory measurements remain scarce; therefore, this study contributes regional surveillance evidence but should not be treated as a validated exposure or compliance survey.
Study Limitations
This study used retrospective monitoring records. Essential metadata-including cultivation system, cultivar, fertilizer and irrigation history, harvest time, exact coordinates, site type, replicate readings, calibration checks, and paired laboratory results-were incomplete. Category-specific samples were small (n=1 – 6), formal normality testing was uninformative, and the 2026 data covered only part of the year. The absence of a complete district-by-site-type cross-tabulation prevented a defensible retrospective spatial map.
Accordingly, the portable-analyzer results are preliminary screening observations. They cannot be used to estimate prevalence, determine legal compliance, quantify analyzer accuracy, or infer causes of nitrate accumulation. These questions require prospective stratified sampling, validated laboratory confirmation, and complete agronomic and spatial metadata. The absence of archived paired samples is an irrecoverable limitation of the retrospective design; coefficients of correlation and bias can only be generated in a new prospective validation experiment and were therefore not estimated in this article.
Conclusion
Regular nitrate surveillance was documented in Pop and Chust districts during 2022–2026. Among 1,890 records, onion, carrot, and potato accounted for 78.8 %. The 31 interpretable portable readings identified leafy herbs, cabbage, beetroot, and selected cucurbit samples as priorities for confirmatory monitoring, but they did not establish regulatory non-compliance.
Statistical reporting was corrected by using 95 % confidence intervals only for n≥3, observed ranges for n=2, and single values for n=1. Monitoring should be optimized as follows: leafy herbs weekly during peak production; melons and other cucurbits every two weeks during harvest; root crops and other vegetables monthly; and preschool or public-institution supplies monthly with immediate follow-up after a trigger. Each monitoring round should include at least 10 samples per district and priority commodity group, while institution-based rounds should include at least five samples per institution type per district. Each sample should receive three standardized portable readings. A mean at 80–100 % of the applicable limit should trigger repeat lot sampling and scheduled laboratory confirmation; a mean above the limit should trigger prompt accredited-laboratory confirmation before any regulatory action. Priority commodities are dill, coriander, cabbage, beetroot, potato, melon, and muskmelon. Complete recording of cultivar, cultivation system, fertilizer and irrigation history, harvest time, coordinates, calibration status, and confirmatory results is necessary for defensible temporal and spatial analysis.
References