Automated digital monitoring systems in debris flow risk assessment: a review of technologies, methods, and practices
УДК + 551.311+004.9
Abstract
The review and analytical article examines the increasing role of automated digital monitoring systems in assessing and managing mudflow risks. Based on the analysis of scientific literature and international experience, it describes how technologies of remote sensing, the Internet of Things (IoT), geographic information systems (GIS) and artificial intelligence (AI) have transformed monitoring of mudflow hazards from a reactive approach to a predictive model. The main components of such systems — rain meters, soil moisture sensors, inclinometers, piezometers, seismic sensors, weather stations and water level measuring devices — as well as data processing functions, threshold analysis, predictive modeling, dynamic risk assessment and GIS-based mapping are systematized. The Mudflow Hazard Index (FHI) is provided as an analytical illustration, indicating its capabilities and limitations. The practical experience of implementing automated systems in Italy, the USA and Nepal is summarized, their advantages, difficulties and promising areas of development, including the use of AI, drones and climate models, are identified. Strategic recommendations have been formulated on policy integration, capacity building, financing, data standardization, public engagement, pilot programs, and research support. The article does not contain original field data, experiments, or author's calculations; all numerical examples are illustrative. The work is aimed at specialists in the field of emergency risk management, hydrology and digital technologies.
Аннотация
В обзорно-аналитической статье рассматривается возрастающая роль автоматизированных цифровых систем мониторинга в оценке и управлении рисками селевых потоков. На основе анализа научной литературы и международного опыта описывается, как технологии дистанционного зондирования, Интернета вещей (IoT), геоинформационных систем (ГИС) и искусственного интеллекта (ИИ) трансформировали мониторинг селевой опасности из реактивного подхода в прогностическую модель. Систематизированы основные компоненты таких систем — дождемеры, датчики влажности почвы, инклинометры, пьезометры, сейсмические датчики, метеостанции и устройства измерения уровня воды, — а также функции обработки данных, порогового анализа, прогнозного моделирования, динамической оценки риска и картирования на основе ГИС. В качестве аналитической иллюстрации приведён индекс селевой опасности (FHI) с указанием его возможностей и ограничений. Обобщён практический опыт внедрения автоматизированных систем в Италии, США и Непале, выявлены их преимущества, трудности и перспективные направления развития, включая применение ИИ, дронов и климатических моделей. Сформулированы стратегические рекомендации по политической интеграции, наращиванию потенциала, финансированию, стандартизации данных, вовлечению общественности, пилотным программам и поддержке научных исследований. Все числовые примеры в статье носят иллюстративный характер. Работа адресована специалистам в области управления чрезвычайными рисками, гидрологии и цифровых технологий.
Keywords: Flood hazard assessment; automated monitoring systems; IoT; remote sensing; GIS; early warning systems; digital sensors; real-time data; emergency risk management; hydrological forecasting.
Ключевые слова: Оценка селевой опасности; автоматизированные системы мониторинга; IoT; дистанционное зондирование; ГИС; системы раннего оповещения; цифровые датчики; данные в реальном времени; управление чрезвычайными рисками; гидрологическое прогнозирование.
Introduction
1. Literature review and review methodology
1.1. Methodology of the review
The literature review was conducted using Scopus, Web of Science, and Google Scholar databases for the period 2000 – 2024 using the keywords «debris flow monitoring», «automated early warning», «IoT hydrology», «GIS debris flow», and «mudflow risk assessment». The criteria for including sources were: peer review, description of monitoring technologies or methods, practical approbation or theoretical justification. A total of 10 sources were selected. Works not related to the topic of digital monitoring of mudflows were excluded from the review.
1.2. Main research directions
In recent years, significant progress has been made in the field of monitoring and forecasting mudflow risks, especially due to the introduction of automated digital monitoring systems [1]. The scientific works of foreign researchers demonstrate effective approaches in this field.
In [2], monitoring systems based on satellite images were developed in river basins and areas with a high risk of mudflows. They proved the possibility of detecting changes in water level from high-resolution images obtained from the Sentinel and MODIS satellites.
In [3], they proposed a methodology for modeling river floods and mudflow risks through hydraulic modeling based on raster digital terrain models (DEM). This study serves as an important tool for predicting mudflows through digital monitoring.
The model developed in [4] suggests assessing mudflow risk by combining remote sensing and geographic information systems (GIS). The available and effective monitoring solutions for regions of Africa and Asia with limited infrastructure are analyzed.
In [5], the authors used automated sensors and Internet of Things (IoT) technologies in hydrological monitoring. The mudslide early warning system they developed has shown particular effectiveness in mountainous areas with rapidly changing weather conditions.
Work [6] describes mudflow detection systems based on intelligent monitoring stations and cloud computing in the northern regions of India. They assessed the probability of floods using algorithms based on artificial intelligence.
In [7], the authors proposed microwave satellite technologies for monitoring surface water flows. They have developed methods for detecting the presence of water on the earth's surface through changes in signal intensity.
The paper [8] describes the need to integrate weather models with hydrological models. It is shown that linking automated monitoring systems with real-time weather data significantly improves efficiency.
In general, foreign studies show that automated digital monitoring systems are one of the most promising tools for detecting, assessing and preventing mudflow hazards. These systems achieve high efficiency when integrated with artificial intelligence, remote sensing, sensors, cloud technologies, GIS, and real-time data streams [9].
The purpose of the work is to systematize and critically analyze modern approaches to automated digital monitoring of mudflows, summarize international experience in using such systems, identify their capabilities and limitations, and formulate practical recommendations for the implementation of automated monitoring systems in mudflow—prone areas.
2. Overview of technologies and components of automated monitoring systems
An automated digital monitoring system is a tool for assessing and managing the risk of mudslides, which is a fast—moving destructive flow of water, mud and rocks, often caused by heavy rains, snowmelt or geological instability in mountainous areas. Such systems support real-time data, early warning, and decision-making using sensors, data analysis, communication networks, and predictive modeling. The main components and functions of such systems are systematized below based on the literature [10].
2.1. Sensors and measuring devices
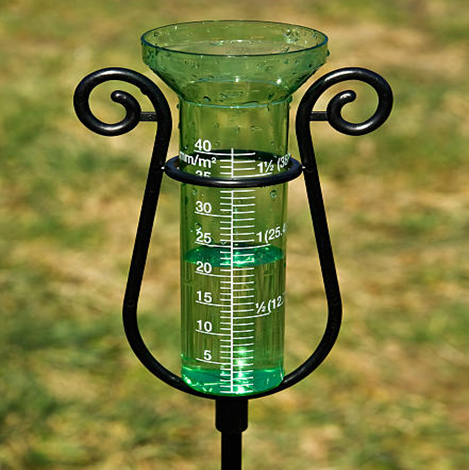
Rain meters. Precipitation is measured; installed on a flat, open area; there are automatic types that transmit information to the center. They work without human intervention, consume little energy, and are applicable in any climate. The disadvantage is that measurements may be inaccurate due to snowfall, dust, and foliage. Nevertheless, it is a necessary tool for predicting mudflow hazards (Fig. 1) [10].
Soil moisture sensors. They are installed deep in the soil, measure the moisture level; they can work in conjunction with drones or GPS devices; remote control and information acquisition are possible. They are used both in agriculture and for assessing the risk of mudslides in mountainous areas. The disadvantage is that the results may vary for different types of soils. The advantage is assistance in early detection of landslides (Fig. 2) [10].

Inclinometers and tilt meters. The angles of inclination and displacement of the ground are measured; they are installed underground or on walls; the risk of landslides can be assessed using auxiliary data. They work continuously and automatically record information. If the installation is incorrect, the results may be incorrect. When connected to other sensors, a single monitoring system is created (Fig. 3, 4) [5].
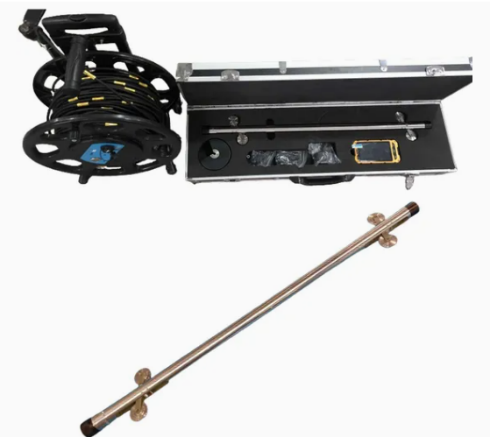
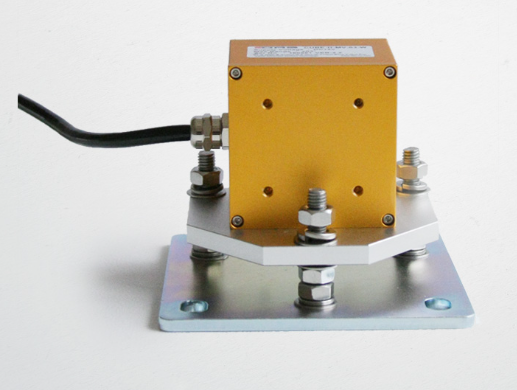
Piezometers. They measure the level and pressure of groundwater; they are placed inside wells; they can be used for a long time and give accurate results. They are used to analyze the movement of soil through groundwater pressure. The disadvantage is the complexity of installation and maintenance (Fig. 5) [5].
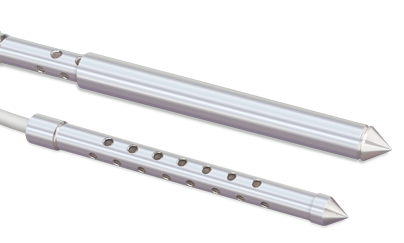
Seismic sensors. They measure ground vibrations and seismic movements; are easy to install, can be placed at many points; detect mudflow tremors and provide real-time information. False signals from external influences are possible (Fig. 6) [7].
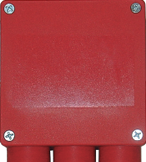
Weather stations. Automatic stations measure air temperature, wind speed, pressure, humidity; transmit information to the center and help prepare forecasts; easily integrate with AI and IoT. The disadvantage is that maintenance is required in case of damage (Fig. 7) [5].
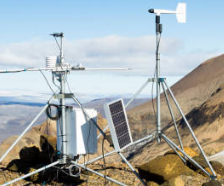
Water level measuring devices. They are used to monitor water levels in rivers and canals; information is collected by automatic sensors; they help predict floods and mudflow hazards; notifications via SMS or signal are possible. The disadvantage is that a sudden change in the water level can lead to a mechanical malfunction (Fig. 8) [7].
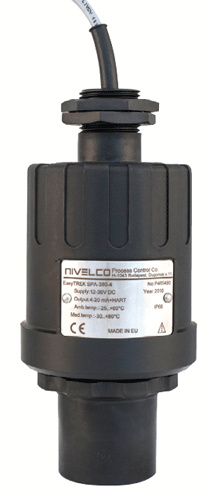
All sensors are connected to data loggers, which record information at certain intervals. Through wireless technologies (IoT, satellite or mobile networks), data is transmitted to centralized servers in real time, which is especially important in remote and mountainous areas [5].
2.2. Data processing and analysis
Cloud or on-premise servers process real-time data using algorithms, statistical models, or machine learning to assess risk levels. Geoinformation systems, integrating spatial data, make it possible to map and visualize mudflow-prone areas [6].
2.3. User interface and notification systems
Through control panels, data is displayed in real time in the form of graphs, heat maps, or risk assessments and is available to emergency management teams. Automated notification systems (SMS, e-mail, siren) warn the relevant authorities and the public when the established risk thresholds are exceeded [4].
2.4. Main functions in mudflow risk assessment
Mudflows are a very dynamic process that depends on rapidly changing environmental conditions. Automated systems, unlike traditional (manual) monitoring, provide continuous and high-frequency data collection. For example, precipitation data is accumulated every few minutes, which makes it possible to detect heavy rains saturating mountain slopes in a timely manner. Sensors of soil moisture and capillary pressure reflect the underground state, invisible to the naked eye [5].
Threshold analysis. The system compares environmental indicators — for example, the amount of precipitation (for example, 50 mm in 24 hours) or the level of soil moisture — with predefined risk standards. If these standards are exceeded, the warning system is automatically activated and gives a signal about the risk of a mudslide. For example, with a precipitation intensity of 10 mm/hour or a soil moisture level above 80 %, a warning about a village can be activated depending on local conditions [8].
Predictive modeling. Machine learning models based on historical mudflow data analyze the data in real time. They take into account the intensity of the rain, the type of soil (for example, clay or loam), the level of slope (for example, the risk increases at >30 °). These models determine the likelihood of mudslides in the region and the extent of their impact. For example, the Random Forest model or neural network, using cumulative precipitation, vegetation cover, and topographic data, can estimate the probability of a moderate mudflow in a designated area at 70 % [6].
Calculation of dynamic risk assessment. The system calculates risk levels for different geographical areas in real time and generates risk assessments. These scores are generated based on predefined thresholds and predictive models. The scores calculated for each region (for example, from 0 to 100) take into account: proximity to watercourses, population density, and the level of infrastructure provision. High-risk areas (for example, with a score above 80) are considered a priority for enhanced monitoring or preparation of an evacuation plan [6].
Early warning and distribution. Detecting the first signs of a mudslide (for example, a rapid increase in soil moisture or minor slope shifts), the system can automatically send warnings to local authorities, emergency services and the public via SMS, mobile applications or sirens; a time reserve is created that allows people to evacuate from dangerous areas, close roads or install protective barriers. For example, in areas with a high risk of mudslides — in the Alps or the Himalayas — automated systems have dramatically reduced human casualties, warning people a few hours before the disaster [5; 9].
2.5. GIS-based risk mapping
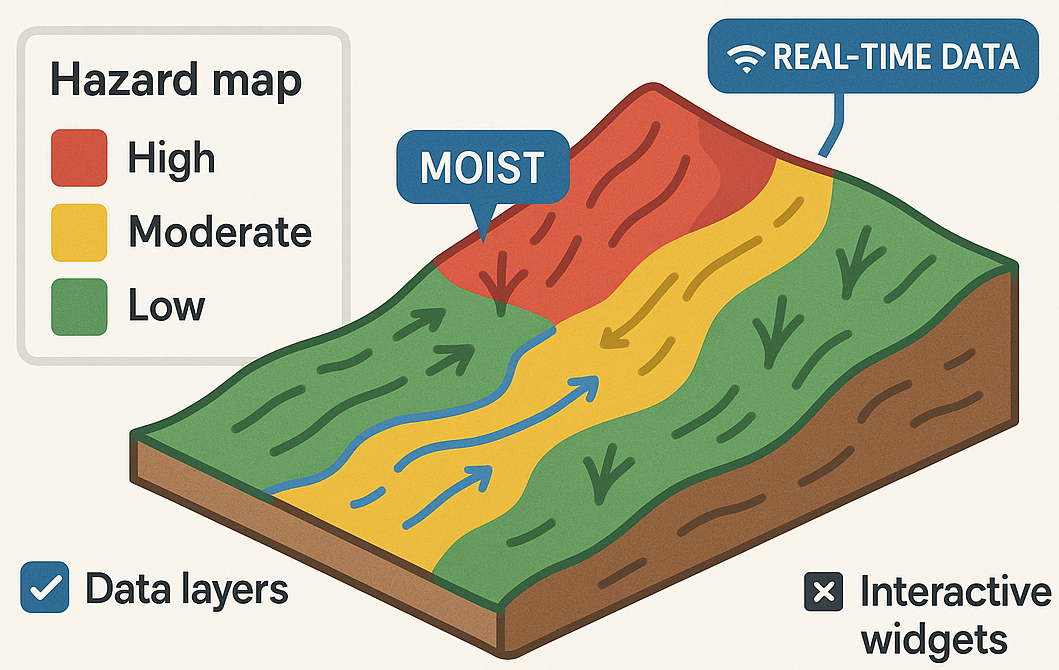
Data integration (fig. 9):
• Terrain data: Elevation data (DEM) is used to identify mudslide-prone slopes and steep plains;
• Soil composition: geotechnical data analyzes the underground composition and identifies areas with unstable soils;
• Historical data on mudflows: information about past events serves as the basis for forecasting models of future risks;
• Real-time sensor data: soil moisture sensors and rain meters provide continuously updated information [3; 4].
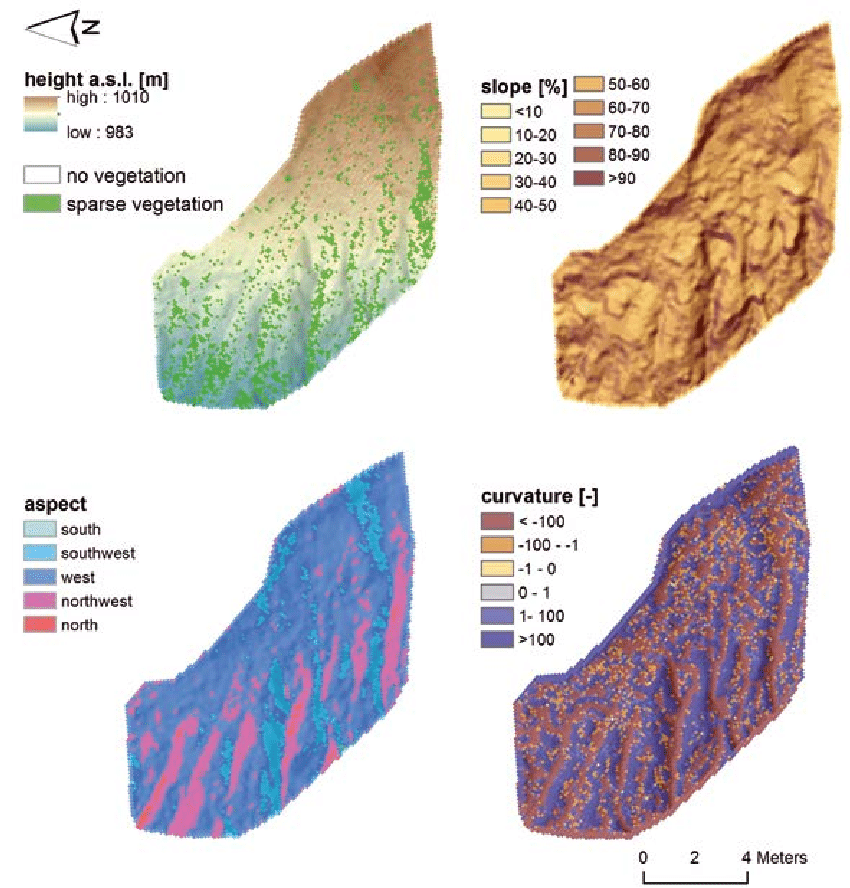
Visualization. On maps created through GIS, various information layers are combined — relief, soils, historical data — and danger zones are marked with clear colors (red — high risk, yellow — medium). Sensor data is constantly updated on maps: for example, if high humidity is detected on a steep slope, the area is automatically marked as dangerous. In support of urban planning, maps identify areas unsuitable for construction and help administrations make decisions about zoning and land use [2].
Access. Web and mobile interfaces allow interested parties (planners, emergency services personnel) to view maps, analyze designated areas and receive information about danger on request; interactive functions (enabling/disabling data layers) increase the efficiency of use [6].
Advantages. Proactive risk management: the consequences of disasters are mitigated by early detection of hazardous areas; informed decisions: urban planners avoid construction in high-risk areas; real-time actions: live data helps to carry out timely evacuation or risk reduction measures; involvement of parties: accessible visualization tools make teams and official authorities active participants [4].
Long-term data analysis. In addition to real-time monitoring, the systems store data for long-term analysis.: identification of trends (for example, an increase in the frequency of mudslides due to climate change); improvement of predictive models by adding new data; support for scientific research on the causes of mudslides and prevention strategies (Fig. 10) [9].
3. Analytical illustration: Mudflow Hazard Index (FHI) as an example of a settlement tool
The FHI formula given below is considered not as an author's development or as the result of an original calculation, but as an illustration of the approach described in the literature [10]. The numerical example is for demonstration purposes and does not purport to reflect the actual characteristics of a particular basin. The coefficients α, β, γ are expert and require calibration for each region.
Mathematical models and formulas integrated with GIS are widely used in automated digital monitoring systems used to assess mudflow risk. One of the most common methods is the calculation of the mudflow Hazard Index (FHI) [10]:
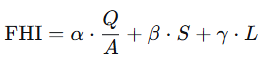
where: Q is the maximum water flow (m3/s); A is the basin area (km2); S is the surface slope (%); L is the length of the flow path (km); α, β, γ are coefficients determined by specialists depending on the situation.
An illustrative example. Suppose the following conditional parameters are set for a mountain basin: Q = 120 m3/s; A = 15 km2; S = 25 %; L = 5 km; α = 0.5, β = 0.3, γ = 0.2.

Interpretation (conditional scale): 0 – 5 — low risk; 5 – 10 — moderate; 10 – 15 — high; >15 — extremely high. With FHI = 12.5, the risk is assessed as high [10].
Limitations. The formula allows quantifying mudflow risk and serves as a criterion for comparing risks in different geographical conditions. It can be calculated automatically when integrating sensor data and digital terrain models (DEM), which reduces the influence of the human factor and allows for real-time analysis [5]. The parameters Q, a, S, and L are considered as physical indicators of natural processes and together provide a holistic view of mudflow risk. When integrated with GIS and AI, the formula creates the possibility of building dynamic risk maps, automatic recognition of dangerous areas and early warning of the population [6].
However, the formula has significant limitations. The main problem is the subjectivity of the coefficients: α, β and γ are determined conditionally by specialists and are not specific to each pool, which creates a risk of overestimation or an increase in the risk level [10]. The formula does not cover all important factors: atmospheric pressure, type of precipitation (rain or snow), soil structure — which reduces the accuracy of the analysis. In addition, the formula is suitable mainly for small mountain basins; in regions with large river systems or complex terrain, it is advisable to use it in conjunction with other models [3; 8].
Thus, FHI can be considered as one of the practical methods for assessing mudflow risk, however, each pool requires an individual approach. The formula should be used as part of a comprehensive analysis, rather than as a «universal solution»; meteorological, geological, and local features should also be taken into account [8; 10].
4. Discussion: limitations and prospects
4.1. Advantages of automated systems
Automated systems have a number of advantages over traditional manual monitoring methods: accuracy and reproducibility (sensors provide highly accurate data, low human error) [5]; wide coverage and scalability (monitoring remote and hard-to-reach areas via satellite or IoT networks [2]); timely response (real-time data processing and notification function); cost-effectiveness (initial costs may be high, but automation reduces consumption in constant manual labor and on-site inspections); integration with other systems (forecast weather models, seismic networks, response platforms) [8]; community activation (delivery of alerts to stressed populations through mobile applications or local alarm systems) [9].
4.2. Labor and restrictions
Despite their superiority, automated systems face practical difficulties: high initial costs (installation of sensors, communication infrastructure and data processing systems requires large investments, especially for developing countries) [10]; maintenance (in harsh weather conditions sensors may require frequent repair or replacement); excessive data volume (large amount of data in if improperly controlled, it can overload the system or the decision maker); false positive and false negative signals (incorrect definition of thresholds or erroneous assumptions in the model can lead to a lack of necessary warnings or unjustified evacuation) [6]; coverage problems (in remote or underdeveloped areas, the system may not work fully due to missing infrastructure – Internet or electricity supply); problems involving the team (effective early warning system notification requires awareness and trust; regular explanatory and educational activities are necessary) [9].
4.3. Examples of practical application
Automated digital monitoring systems for mudflow risk have been successfully implemented in a number of regions around the world.
Italy (Alpine region). In the Italian Alps, there is a system for monitoring the risk of landslides and mudslides through a network of rain meters, soil sensors and radars (Fig. 11). In 2020, such a system in the Aosta Valley made it possible to timely warn the population about a large village and lay the foundation for evacuation measures [4].
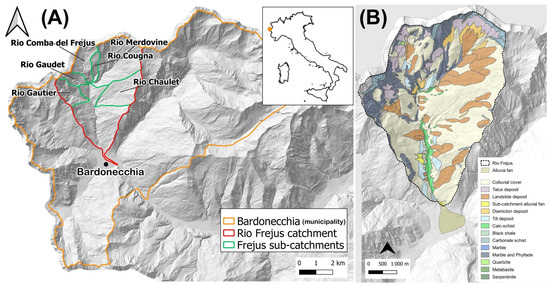
The example is chosen as an illustration of a comprehensive approach applicable to the mountainous regions of Uzbekistan.
California, USA. After the devastating mudslides in Montecito in 2018 Automated systems have been implemented in California that provide information about precipitation and soil moisture in real time; they have proven effective in predicting possible flash floods after fires [5].
Nepal. In the Himalayas, IoT-based and satellite-based systems monitor remote, inaccessible slopes; this information serves as an important resource for local authorities and NGOs in preparing for emergencies [9].
4.4. Promising areas
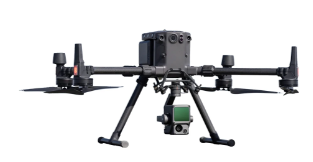
Technology development expands the capabilities of automated monitoring systems: artificial intelligence and machine learning (updated algorithms provide more accurate results when analyzing multiparametric data) [6]; drones and remote sensing (drones with LiDAR or infrared images complement ground-based sensors, mapping changes in terrain in real time, Fig. 12) [7]; adaptation to climate change (systems are being developed that take into account factors that increase the risk of mudslides, such as heavy rains or rapid glacier subsidence) [8]; collective integration (notification and informing the population through mobile applications and social networks) [9].
4.5. Infrastructure costs and efficiency assessment
The implementation of an automated mudflow monitoring system requires significant primary infrastructure facilities -sensors, data transmission equipment (GSM, satellites, radio), solar panels, server centers, drones, remote control terminals, and spare parts. These costs can be particularly high for mountainous and hard-to-reach areas. An illustrative formula is used in the literature for an approximate assessment of economic efficiency [10]:
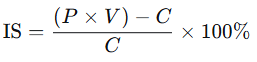
where IS is the economic efficiency (%); P is the proportion of the population or facilities saved from a possible disaster (%); V is the total value of the material assets saved; C is the cost of infrastructure implementation.
An illustrative example. If C = 500,000,V=2000000,V=2000000, P = 80 %, then:

This means an effect of about 2.2 per 1 investment. The example is conditional; the technique requires a source [10] and real source data for a specific object.
4.6. Technical capacity, data integration and sustainability
Technical potential. Automated systems are based on high technologies, and their installations are insufficient. For effective use, it is necessary to properly understand the structure, operating principle, software and maintenance procedures. Working with sensors, drones, GIS platforms, and AI algorithms requires certain skills. The reliable and uninterrupted functioning of the system depends primarily on qualified specialists; it is necessary to constantly implement a system of their special training, retraining and practical application. In this area, the shortage of personnel is one of the main problems [10].
Data integration. Information from only one agency is not available for mudflow risk assessment and early warning. The exchange of information between meteorology, hydrology, urban planning, ecology and information technology, the harmonization of approaches and interaction through a single electronic platform increase efficiency. The biggest obstacle is the totality of data and insufficient agency interaction: if meteorological data is not related to mudflow topography, forecast accuracy decreases. It is advisable to build data integration at the level of public policy [8].
Stability. Natural disasters often disrupt infrastructure -electricity, communications, and the Internet. The monitoring system must be stable in order to function in extreme situations: it must have an autonomous power source, offline mode, and backup data storage channels. In practice, systems are briefly tested only under normal conditions, whereas in real poverty the main burden falls on these infrastructures; support by diesel generators, solar panels or satellite communications should be a mandatory requirement [9].
Development prospects. To increase the efficiency and sustainability of the system, it is necessary to develop in several directions: open technologies can reduce costs and attract the scientific community; the development of public-private partnerships expands financial resources and the introduction of new solutions; the involvement of the population in the monitoring process ensures public participation and prompt collection of information. In the future, such systems can work not only centrally, but also on the principle of «down up»: the population transmits information via a mobile application, entrepreneurs introduce technologies, and the state coordinates. This approach ensures the speed, inclusiveness and sustainability of the system [10].
Conclusion
The current review and analytical work does not claim to have original empirical results; its conclusions are based on the systematization of literature and international experience. Automated digital monitoring systems represent a significant step in assessing mudflow risk.: Due to accurate, proprietary and practical data, they allow stakeholders to minimize damage and save people's lives. The integration of IoT, remote sensing and AI technologies into emergency management systems is an important step towards smart and secure communities. Based on the results of the review, the following strategic recommendations were formulated.
Political integration. It is advisable for States to officially include automated monitoring systems in national strategies to ensure national security and mitigate the effects of natural disasters; this will strengthen their legal framework and coordinate the activities of all structures [10].
Capacity building. For the effective use of automated systems, it is necessary to organize regular training events for local authorities and the population: knowing how to act in case of a threat to the village directly allows saving lives [9].
The financing model. Attracting international grants, investments, and public-private partnership projects is of great importance for infrastructure expansion: these funds allow the creation of sensors, drones, data centers, and on-site technical support systems [10].
Standards of flexibility. To facilitate data exchange between organizations, it is necessary to introduce a single data format and exchange protocols; integration of hydrometeorological data with GIS platforms significantly improves forecast accuracy [8].
Public engagement. Information should be disseminated through mobile applications, SMS, and social networks to temporarily warn the population about mudflow hazards and develop safety skills; thus, not only government agencies, but also citizens themselves will be involved in monitoring [9].
Pilot programs. It is advisable to implement special pilot projects taking into account the natural and geographical features of each region: for example, in mountainous mudflow-prone areas, the optimal solution is selected by checking automated radar sensors [5].
Support for scientific research. Simplification of engineering work and rapid integration of data analysis are achieved through the expansion and effective application of research in this area; the creation of analytical models based on AI can expand the possibilities of predicting mudflows in the future [6].
References