Real-time classification and compliance assessment of inorganic compounds in agricultural groundwater using smart hydrogeological IoT networks
УДК 628.1+004.67
Abstract
Agricultural groundwater may contain inorganic constituents originating from natural mineral dissolution, fertilizers, and irrigation return flows. Conventional laboratory monitoring is accurate but often limited by delayed results and insufficient sampling frequency. This study proposes a smart hydrogeological Internet of Things (IoT) network for real-time monitoring, classification, and compliance assessment of groundwater used for irrigation. The system integrates multiparameter sensors, wireless communication, geospatial databases, and machine-learning algorithms to monitor key water-quality parameters, including pH, electrical conductivity, total dissolved solids, major ions, and selected potentially toxic elements. Collected data are automatically validated, classified using hydrochemical and irrigation-water quality indicators, and compared with established standards. The framework can generate early-warning notifications and digital compliance reports when permissible limits are exceeded. This approach reduces monitoring delays, improves data traceability, and supports timely decision-making for sustainable agricultural water management.
Аннотация
Сельскохозяйственные подземные воды могут содержать неорганические компоненты, происходящие из естественного растворения минералов, удобрений и возвратных оросительных потоков. Обычный лабораторный мониторинг точен, но часто ограничен задержкой результатов и недостаточной частотой отбора проб. В данном исследовании предлагается интеллектуальная гидрогеологическая сеть Интернета вещей (IoT) для мониторинга в реальном времени, классификации и оценки соответствия подземных вод, используемых для орошения. Система интегрирует многопараметрические датчики, беспроводную связь, геопространственные базы данных и алгоритмы машинного обучения для мониторинга ключевых показателей качества воды, включая водородный показатель, электрическую проводимость, общее содержание растворённых веществ, основные ионы и отдельные потенциально токсичные элементы. Собранные данные автоматически проверяются, классифицируются с использованием гидрохимических показателей и показателей качества оросительной воды и сравниваются с установленными стандартами. Платформа может генерировать предупреждающие уведомления и цифровые отчёты о соответствии при превышении допустимых пределов. Данный подход снижает задержки мониторинга, повышает отслеживаемость данных и поддерживает своевременное принятие решений для устойчивого управления сельскохозяйственными водными ресурсами.
Keywords: Agricultural groundwater; inorganic constituents; Internet of Things; real-time monitoring; hydrochemical classification; irrigation-water quality; machine learning; compliance assessment.
Ключевые слова: Сельскохозяйственные подземные воды; неорганические компоненты; Интернет вещей; мониторинг в реальном времени; гидрохимическая классификация; качество оросительной воды; машинное обучение; оценка соответствия.
1. Introduction
Groundwater is an important source of irrigation, particularly in arid and semi-arid regions with limited surface-water resources. Approximately 69 % of global groundwater abstraction is used by agriculture, and groundwater supplies nearly one-quarter of irrigation water worldwide [1]. Therefore, its availability and chemical quality are essential for sustainable agricultural production [2].
Groundwater chemistry is influenced by natural processes, including mineral dissolution, evaporation, ion exchange, and water–rock interactions. Agricultural activities, particularly fertilizer application and irrigation return flows, may increase nitrate, ammonium, chloride, sulfate, and potentially toxic element concentrations [3,4]. Long-term use of unsuitable groundwater can reduce crop productivity, increase soil salinity, and degrade irrigated land.
Irrigation-water suitability is commonly assessed using electrical conductivity (EC), total dissolved solids (TDS), pH, sodium adsorption ratio (SAR), residual sodium carbonate (RSC), major ions, and potentially toxic elements. These indicators characterize salinity, sodicity, infiltration, and toxicity risks. According to FAO guidelines, excessive salinity and sodium may negatively affect plant water availability and soil structure [5].
Conventional groundwater monitoring relies on periodic sampling and laboratory analysis. Although reliable, it is time-consuming and may fail to detect short-term chemical changes. Internet of Things (IoT) technologies provide continuous monitoring through sensors, wireless communication, and cloud-based data management, enabling real-time measurements and early warnings when established limits are exceeded. However, many existing systems monitor only basic parameters and do not integrate sensor data with hydrochemical classification and agricultural water-quality standards [6,7].
Therefore, this study aims to develop a smart hydrogeological IoT network for the real-time monitoring, classification, and compliance assessment of inorganic constituents in agricultural groundwater [8]. The proposed framework integrates multiparameter sensors, hydrochemical indices, geospatial analysis, and machine-learning algorithms to evaluate salinity, sodicity, ionic composition, and contamination risks. In this study, certification refers to automated preliminary conformity assessment rather than formal regulatory certification, providing early warnings and supporting evidence-based groundwater management [9,10].
2. Materials and Methods
2.1. Study Design and Monitoring Sites
A real-time groundwater monitoring framework was designed for agricultural areas where groundwater is used as the principal or supplementary source of irrigation. Monitoring wells were selected to represent different hydrogeological and agricultural conditions, including variations in aquifer depth, crop type, fertilizer application, soil salinity, and proximity to drainage systems. The geographical coordinates and elevations of all monitoring points were recorded using a Global Positioning System device.
Before installation of the Internet of Things (IoT) units, each well was purged to remove stagnant water. Groundwater samples were collected after stabilization of pH, temperature, and electrical conductivity. The monitoring program consisted of two complementary components:
1. Continuous in situ measurements using IoT-connected sensors;
2. Periodic laboratory analysis for sensor calibration and analytical validation.
The sensors recorded observations at 15-minute intervals. Hourly and daily averages were automatically calculated and stored in the cloud database. Laboratory samples were collected at predetermined intervals and transported in accordance with standard water-sampling procedures.
2.2. IoT-Based Hydrogeological Monitoring Network
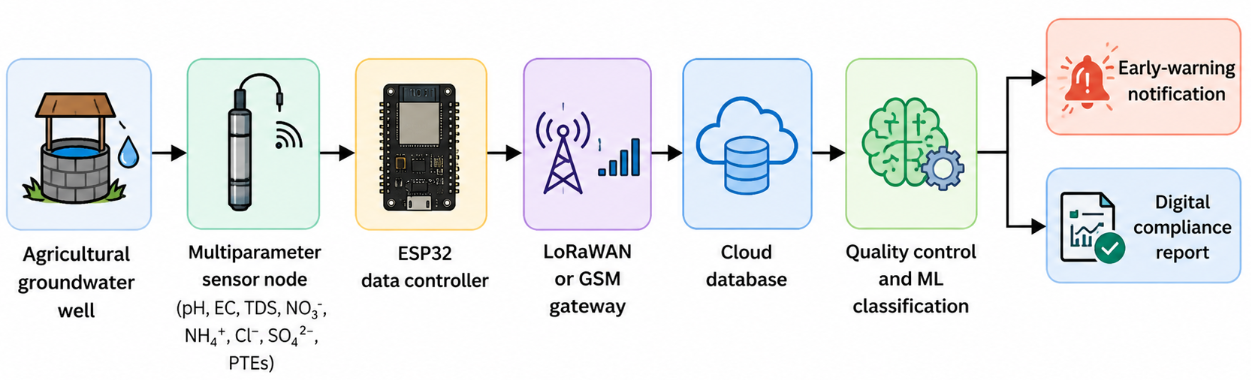
Each monitoring node consisted of a multiparameter sensor unit, microcontroller, communication module, power-supply system, and data-storage component. The sensor unit was installed inside or immediately adjacent to the groundwater well. An ESP32-type microcontroller collected and processed sensor signals. Data transmission was performed using LoRaWAN, GSM/GPRS, or Wi-Fi, depending on network availability.
Solar panels with rechargeable batteries were used at monitoring sites without a stable electricity supply. If wireless communication was temporarily unavailable, observations were stored locally and transmitted automatically after restoration of the connection.
2.3. Monitored Hydrochemical Parameters
The parameters were selected according to their importance for hydrochemical classification, irrigation suitability, soil salinity, nutrient contamination, and potentially toxic element assessment.
Table 1. Parameters monitored by the smart hydrogeological network
| Parameter | Unit | Measurement method | Frequency | Agricultural relevance |
|---|---|---|---|---|
| Temperature, pH | °C; pH | Digital/electrochemical sensors | 15 min | Hydrochemical conditions |
| EC, TDS | dS m⁻¹; mg L⁻¹ | Conductivity sensor/calculation | 15 min | Salinity and mineralization |
| ORP | mV | ORP electrode | 15 min | Redox conditions |
| Nitrate, ammonium | mg L⁻¹ | Ion-selective sensors | Hourly | Fertilizer contamination |
| Chloride, sulfate | mg L⁻¹ | Sensors/ion chromatography | Hourly/periodic | Salinity and ion toxicity |
| Na, Ca, Mg | mg L⁻¹ | Laboratory analysis | Periodic | Sodicity and SAR |
| Bicarbonate | mg L⁻¹ | Titrimetric method | Periodic | Alkalinity and RSC |
| Boron | mg L⁻¹ | ICP-OES/spectrophotometry | Periodic | Crop toxicity |
| Potentially toxic elements | µg L⁻¹ | ICP-OES/ICP-MS | Periodic | Soil and crop contamination |
2.4. Sensor Calibration and Laboratory Validation
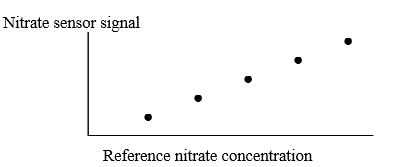
All sensors were calibrated before field installation using certified standard solutions. The pH sensor was calibrated using buffer solutions of pH 4.00, 7.00, and 10.00. Electrical conductivity sensors were calibrated with certified conductivity standards selected according to the expected groundwater salinity range. Nitrate, ammonium, and chloride sensors were calibrated using at least five standard concentrations.
A linear or polynomial calibration model was selected according to the sensor response:
C=aS+b
where (C) is the calculated concentration, (S) is the sensor signal, (a) is the calibration slope, and (b) is the intercept.
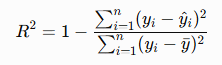
Calibration performance was evaluated using the coefficient of determination:
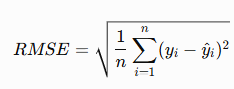
Sensor measurements were compared with laboratory results using the root mean square error:
The mean absolute error was calculated as:
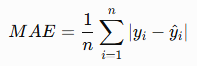
Here, (yi) represents the laboratory result, represents the corresponding sensor-derived value, and (n) is the number of paired observations. Sensor drift was evaluated periodically, and recalibration was performed when the difference between sensor and reference measurements exceeded the predefined tolerance.
The calibration results should be presented in the following graphical form after experimental measurements have been obtained:
2.5. Quality Control of Real-Time Data
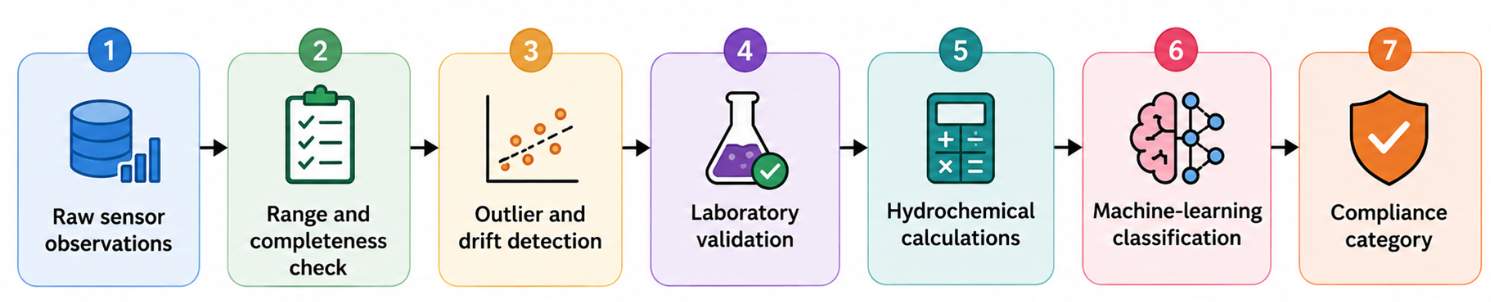
Raw observations were automatically screened before hydrochemical classification. The data-quality procedure included range checking, detection of missing values, removal of physically impossible observations, identification of sudden sensor spikes, and comparison with laboratory measurements.
An observation was flagged when:
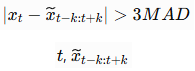
where (xt) is the observation at time (t),) is the moving median, and (MAD) is the median absolute deviation within the selected time window. Flagged values were retained in the original database but excluded from automated certification until validation.
2.6. Hydrochemical Calculations
The sodium adsorption ratio was calculated to evaluate the potential effect of groundwater on soil structure:
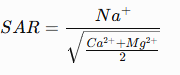
where (Na+), (Ca2+), and (Mg2+) are expressed in milliequivalents per litre.
Residual sodium carbonate was calculated as:

All concentrations used in the RSC calculation were expressed in milliequivalents per litre. The ionic balance error was determined to verify the reliability of the hydrochemical analysis:

Analyses with an absolute ionic balance error greater than 10 % were flagged for re-examination.
The dominant cations and anions were used to identify the hydrochemical facies of each groundwater sample. Piper and Schoeller diagrams were subsequently constructed to distinguish calcium–bicarbonate, sodium–chloride, calcium–sulfate, and mixed groundwater types.
3. Results
The real-time monitoring network revealed spatial and temporal variations in agricultural groundwater quality. Groundwater was predominantly neutral to slightly alkaline, while variations in electrical conductivity (EC) and total dissolved solids (TDS) indicated different mineralization and salinity levels. Nitrate showed the greatest temporal variability, particularly after fertilizer application and irrigation, with higher concentrations near intensively cultivated fields. Chloride and sulfate were relatively stable, although elevated values occurred near agricultural drainage systems. SAR and RSC values indicated potential risks to soil permeability under long-term irrigation. Sensor measurements showed good agreement with laboratory analyses. EC and pH sensors demonstrated the highest stability, whereas nitrate and chloride sensors required more frequent calibration. Laboratory verification remained necessary for boron and potentially toxic elements.
Based on EC, TDS, SAR, RSC, nitrate, chloride, and boron, groundwater was classified as suitable, moderately restricted, or severely restricted for irrigation. Moderately restricted water required appropriate management, while severely restricted sources required confirmatory laboratory analysis.
Among the evaluated machine-learning algorithms, Random Forest provided the most reliable classification, with EC, nitrate, SAR, TDS, and chloride as the most influential variables. The IoT platform successfully generated automatic warnings when established limits were exceeded, enabling rapid identification of hydrochemical changes relevant to irrigated soils and crops.
4. Discussion
The findings demonstrate that combining IoT sensors with hydrochemical indicators can improve agricultural groundwater assessment. Unlike periodic laboratory sampling, real-time monitoring detects short-term changes caused by fertilizer application, irrigation return flows, seasonal recharge, and evaporation.
Electrical conductivity and TDS were the main indicators of groundwater salinity, while nitrate showed greater temporal variability in intensively cultivated areas. This may be associated with fertilizer leaching and agricultural drainage, consistent with previous studies [2,3]. The combined assessment of EC, SAR, and RSC provided a more reliable evaluation of irrigation suitability than any individual parameter.
The agreement between sensor and laboratory measurements confirmed the potential of IoT-based monitoring. However, sensor drift, temperature effects, and ionic interference may influence accuracy. Regular calibration and periodic laboratory validation are therefore required, particularly for nitrate, chloride, boron, and potentially toxic elements.
The Random Forest model effectively classified groundwater using EC, TDS, nitrate, chloride, SAR, and RSC. Nevertheless, the model should be validated using local and seasonal data. Overall, the proposed system enables rapid preliminary compliance assessment and early warning, while official certification should remain based on accredited laboratory analysis.
5. Conclusion
This study presents a smart hydrogeological IoT network for the real-time monitoring, classification, and compliance assessment of inorganic constituents in agricultural groundwater. The integration of multiparameter sensors, wireless data transmission, hydrochemical indices, and machine-learning algorithms enables continuous evaluation of groundwater salinity, sodicity, ionic composition, and contamination risk. Electrical conductivity, TDS, nitrate, chloride, SAR, and RSC were identified as important indicators of irrigation-water suitability. The Random Forest algorithm provided an effective approach for automated groundwater classification and early-warning generation. However, regular sensor calibration and periodic laboratory validation remain essential, particularly for boron and potentially toxic elements. The proposed system can support rapid decision-making, improve groundwater-quality management, and reduce the environmental risks associated with unsuitable irrigation water. Official certification should nevertheless be confirmed through accredited laboratory analysis.
References