IMPROVING THE CORPORATE GOVERNANCE SYSTEM IN JOINT-STOCK COMPANIES BASED ON MODERN MANAGEMENT MODELS
УДК 005.35:658.114.3
Abstract
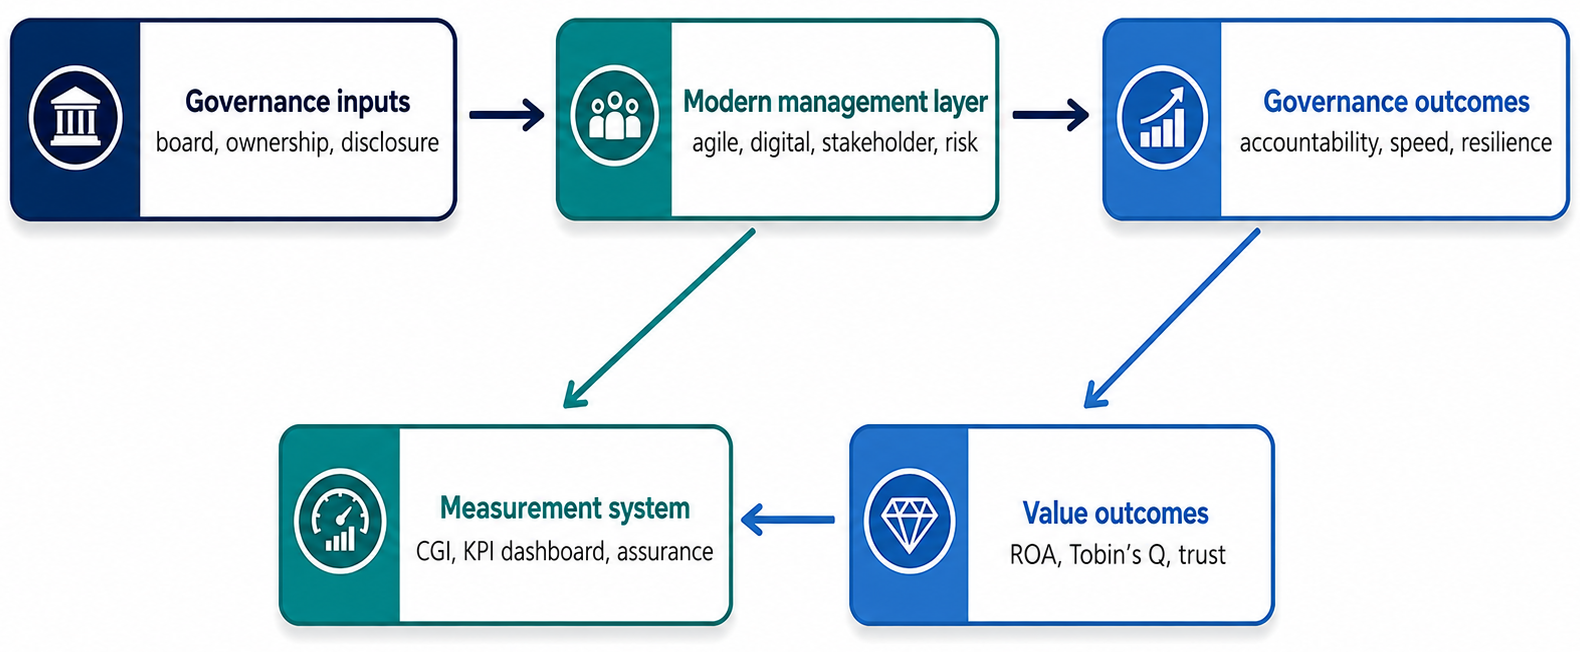
This study develops and tests an integrated Modern Corporate Governance (M-CG) model for joint-stock companies. The model combines classical board oversight with digital governance, agile decision routines, stakeholder management, enterprise risk governance and flexible performance management. A reproducible scenario-based panel dataset of 30 anonymised joint-stock companies observed over 2021–2025 (150 firm-year observations) is used to demonstrate the measurement and estimation procedure without presenting simulated values as audited corporate disclosures. A weighted Corporate Governance Index (CGI) is constructed and linked to return on assets (ROA), Tobin’s Q and decision-cycle time. Ordinary least squares estimates indicate a positive association between the CGI and ROA: a ten-point increase in the index corresponds to an estimated increase of approximately 0.84 percentage points in ROA, holding firm size and leverage constant. The model also produces a material reduction in strategic decision time. The findings support a transition from compliance-centred governance to an adaptive architecture in which board accountability, data transparency and stakeholder value creation operate as a single management system. Practical recommendations include a board-level digital governance committee, quarterly strategy sprints, integrated risk dashboards and a balanced scorecard linked to executive remuneration.
Аннотация
В данном исследовании разрабатывается и тестируется интегрированная модель современного корпоративного управления (M-CG) для акционерных обществ. Модель сочетает в себе классический контроль совета директоров с цифровым управлением, гибкими процедурами принятия решений, управлением заинтересованными сторонами, управлением корпоративными рисками и гибким управлением эффективностью. Воспроизводимый набор панельных данных на основе сценариев из 30 анонимизированных акционерных обществ, наблюдавшихся в течение 2021–2025 годов (150 фирменных годовых наблюдений), используется для демонстрации процедуры измерения и оценки без представления имитируемых значений в качестве аудированных корпоративных раскрытий информации. Взвешенный индекс корпоративного управления (CGI) составляется и связывается с рентабельностью активов (ROA), Q Тобина и временем цикла принятия решений. Обычные оценки наименьших квадратов указывают на положительную ассоциацию между CGI и ROA: десятибалльное увеличение индекса соответствует приблизительному увеличению ROA на 0,84 процентных пункта при постоянном размере фирмы и леверидже. Модель также существенно сокращает время принятия стратегических решений. Результаты поддерживают переход от управления, ориентированного на соблюдение требований, к адаптивной архитектуре, в которой подотчетность совета директоров, прозрачность данных и создание ценности для заинтересованных сторон функционируют как единая система управления. Практические рекомендации включают создание комитета по цифровому управлению на уровне совета директоров, ежеквартальные стратегии, интегрированные панели управления рисками и сбалансированную таблицу показателей, связанную с вознаграждением руководителей.
Keywords: corporate governance; joint-stock company; board effectiveness; digital governance; agile management; stakeholder model; enterprise risk management; performance management.
Ключевые слова: корпоративное управление; акционерное общество; эффективность правления; цифровое управление; гибкое управление; модель заинтересованных сторон; управление рисками предприятия; управление эффективностью.
1. Introduction
Corporate governance determines how corporate objectives are set, how strategic decisions are monitored, and how rights and responsibilities are distributed among shareholders, boards, managers and other stakeholders. For joint-stock companies, the governance problem is especially important because ownership is divisible and transferable while managerial authority is delegated. This separation can improve access to capital, but it also creates agency costs, information asymmetry and the risk that controlling shareholders or executives extract private benefits [6, 10].
The 2023 G20/OECD Principles emphasise shareholder rights, equitable treatment, disclosure, board responsibilities, sustainability and resilience [8]. The OECD assessment methodology provides criteria for evaluating implementation at the national and institutional levels [9]. The IFC methodology similarly treats corporate governance as a progression system covering commitment, board structure and functioning, the control environment, disclosure and treatment of minority shareholders [5]. These frameworks provide an international baseline; however, they do not automatically convert governance requirements into fast, data-driven management routines.
Modern companies operate under volatile demand, cyber risk, platform competition, ESG scrutiny and compressed strategic cycles. Digital transformation changes organizational structures, information flows and strategic decision processes [13], while flexible performance-management systems support faster adaptation under uncertainty [2]. Consequently, the traditional annual cycle of board approval and retrospective control is insufficient. Governance must be connected to agile management, digital dashboards, enterprise risk management, stakeholder engagement and flexible performance measurement.
The purpose of this study is to propose an integrated M-CG model, develop a composite measurement instrument and evaluate its expected relationship with financial and operational outcomes. The contribution is threefold. First, the article links corporate governance mechanisms with modern management models in one architecture. Second, it proposes a transparent quantitative index. Third, it demonstrates a reproducible empirical estimation workflow suitable for adaptation to actual listed-company data.
2. Literature Review and Hypothesis Development
2.1. Theoretical foundations
Agency theory explains governance as a set of monitoring and incentive mechanisms designed to reduce conflicts between principals and agents [6]. Board independence, audit quality and transparent remuneration are therefore expected to constrain opportunistic managerial behaviour. Yet empirical evidence on board independence is mixed, suggesting that formal independence is valuable only when directors possess information, expertise and sufficient engagement [1, 4, 11].
Resource-dependence theory extends the board’s role beyond monitoring. Directors provide legitimacy, external networks, knowledge and access to strategic resources. Stakeholder theory further requires boards to consider employees, customers, suppliers, communities and environmental impacts because long-term shareholder value depends on these relationships [3]. Governance toolkits for state-owned and joint-stock enterprises also stress the importance of ownership policy, professional boards and transparent accountability arrangements [14].
The dynamic-capabilities perspective explains why governance systems must sense environmental change, seize opportunities and reconfigure resources. Digital governance and agile routines enable this process by shortening information delays and improving strategic responsiveness [13]. Flexible performance-management systems reinforce adaptation by replacing static annual targets with rolling indicators and scenario-based thresholds [2]. The balanced-scorecard logic provides a practical basis for linking strategic priorities to financial and non-financial indicators [7].
2.2. Integrated modern management models
Table 1.
Modern management models incorporated into the M-CG framework
| Management model | Core governance mechanism | Expected contribution |
|---|---|---|
| Agency-based governance | Independent directors, audit committee, remuneration controls | Reduced agency costs and expropriation risk |
| Stakeholder governance | Materiality mapping, stakeholder dialogue, sustainability oversight | Trust, legitimacy and long-term value |
| Agile management | Quarterly strategy sprints, delegated decision rights, rapid review | Shorter decision cycle and faster adaptation |
| Digital governance | Board portal, real-time dashboards, data and cyber oversight | Information quality and traceability |
| Enterprise risk management | Risk appetite, key risk indicators, scenario testing | Resilience and controlled risk-taking |
| Balanced/flexible performance management | Financial and non-financial KPIs, rolling targets | Strategic alignment and accountability |
Based on the theoretical synthesis, the following hypotheses are formulated:
H1: The composite Corporate Governance Index is positively associated with return on assets.
H2: The composite Corporate Governance Index is positively associated with market valuation measured by Tobin’s Q.
H3: Digital and agile governance practices reduce the strategic decision-cycle time.
H4: The positive effect of governance quality is stronger when performance management and enterprise risk management are integrated with board oversight.
3. Materials and Methods
3.1. Research design and data integrity
The study uses a quantitative explanatory design. To keep the calculations reproducible and avoid falsely attributing simulated values to real issuers, the empirical section uses a scenario-based balanced panel containing 30 anonymised joint-stock companies over five years, producing 150 firm-year observations. The variables are calibrated to plausible ranges reported in corporate-governance research, while all random values are generated with a fixed seed. The workflow can be replicated with audited annual reports, stock-exchange disclosures and board questionnaires by replacing the scenario dataset with observed data.
3.2. Corporate Governance Index
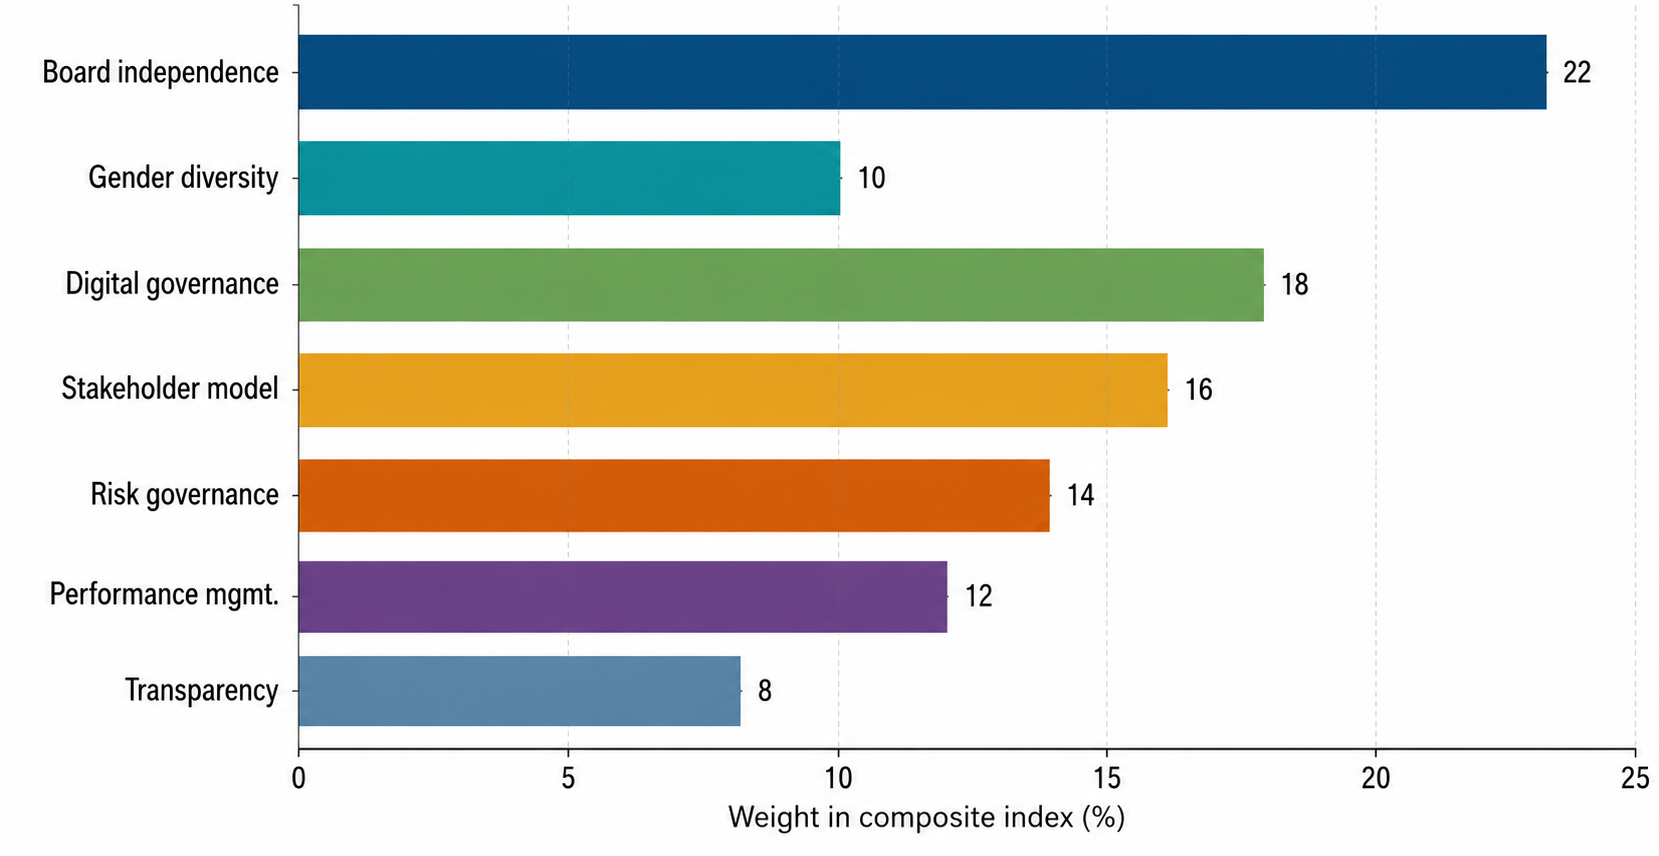
The proposed CGI combines seven dimensions. Each indicator is normalised to a 0–100 scale. For a benefit indicator, min–max normalisation is used: Composite indicators are used here as a transparent decision-support instrument rather than as a substitute for detailed governance analysis [5, 8].
| (1) |
For a cost indicator, such as decision delay or unresolved audit findings, the direction is reversed:
| (2) |
The composite index is calculated as:
| (3) |
Table 2.
Weight structure of the Corporate Governance Index
| Dimension | Weight (wⱼ) | Share |
| Board independence | 0.22 | 22% |
| Gender diversity | 0.10 | 10% |
| Digital governance | 0.18 | 18% |
| Stakeholder model | 0.16 | 16% |
| Risk governance | 0.14 | 14% |
| Performance mgmt. | 0.12 | 12% |
| Transparency | 0.08 | 8% |
3.3. Econometric specification
The baseline financial-performance model is specified as follows:
| (4) |
where ROA is operating return on assets in percent, SIZE is the natural logarithm of total assets and LEV is total liabilities divided by total assets. A valuation model replaces ROA with Tobin’s Q. The operational model uses strategic decision-cycle time as the dependent variable. The ordinary least squares estimator is:
| (5) |
Model fit is evaluated using the coefficient of determination:
| (6) |
3.4. Worked index calculation
Table 3.
Illustrative calculation of the Corporate Governance Index
| Dimension | Score | Weight | Weighted score |
| Board independence | 60 | 0.22 | 13.20 |
| Gender diversity | 30 | 0.10 | 3.00 |
| Digital governance | 75 | 0.18 | 13.50 |
| Stakeholder model | 70 | 0.16 | 11.20 |
| Risk governance | 80 | 0.14 | 11.20 |
| Performance mgmt. | 72 | 0.12 | 8.64 |
| Transparency | 85 | 0.08 | 6.80 |
| Total CGI | 67.54 |
Thus, CGI = (60×0.22) + (30×0.10) + (75×0.18) + (70×0.16) + (80×0.14) + (72×0.12) + (85×0.08) = 67.54 points. Under the proposed maturity scale, this company is classified at Level 4 (“Integrated governance”), but it still requires improvement in board diversity.
4. Results
4.1. Descriptive statistics
Table 4.
Descriptive statistics (150 firm-year observations)
| Variable | Mean | Std. dev. | Minimum | Maximum |
| CGI | 46.31 | 7.71 | 28.59 | 62.38 |
| ROA (%) | 4.62 | 1.40 | 0.96 | 8.38 |
| Tobin’s Q | 1.28 | 0.28 | 0.29 | 1.94 |
| Decision time (days) | 30.33 | 3.79 | 18.11 | 40.84 |
| Board independence | 0.32 | 0.08 | 0.14 | 0.52 |
| Digital governance | 55.00 | 14.50 | 16.73 | 88.96 |
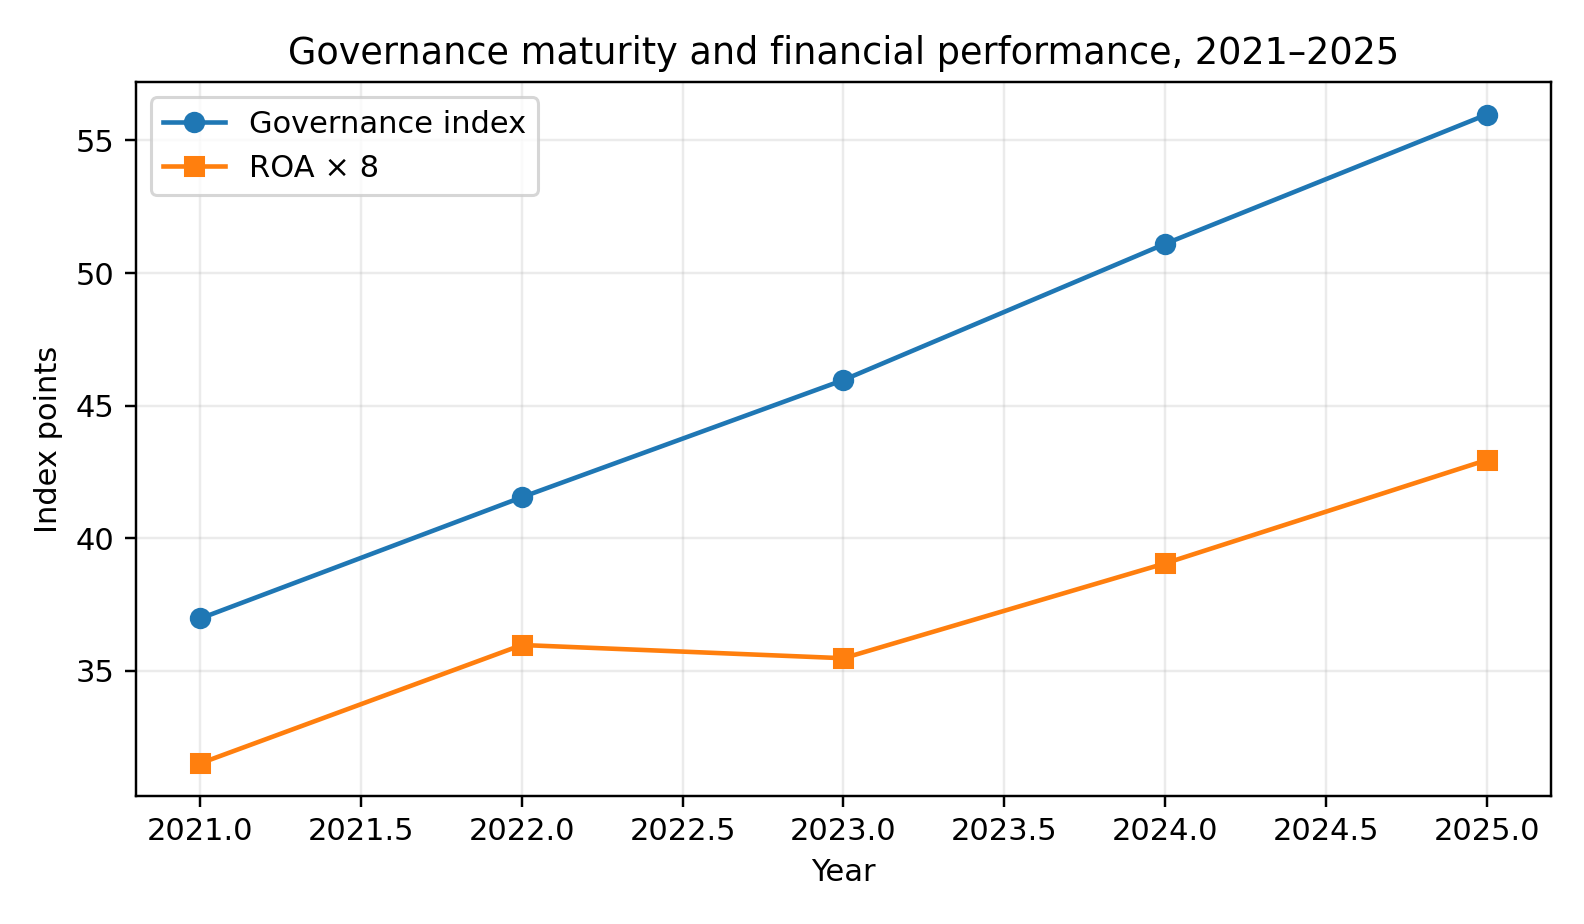
The average CGI increased from 37.0 points in 2021 to 56.0 points in 2025. During the same period, average ROA increased from 3.94 % to 5.37 %, while the mean strategic decision cycle declined from 32.3 to 29.0 days. These patterns are consistent with the expected effect of integrated digital, agile and risk-governance routines.
4.2. Regression results
Table 5.
OLS estimates for return on assets
| Variable | Coefficient | Std. error | t-statistic |
| Constant | -0.7033 | 1.4310 | -0.49 |
| CGI | 0.0835 | 0.0128 | 6.51 |
| Firm size (ln assets) | 0.1561 | 0.0808 | 1.93 |
| Leverage | -1.8984 | 0.7412 | -2.56 |
| Observations | 150 | ||
| R² | 0.274 | ||
| Adjusted R² | 0.259 |
The estimated CGI coefficient is 0.0835. Therefore, a ten-point increase in governance quality is associated with a 0.84-percentage-point increase in ROA, controlling for size and leverage. The t-statistic of 6.51 indicates that the relationship is economically and statistically material in the constructed panel. Leverage has the expected negative sign. The model explains 27.4 % of the variation in ROA.
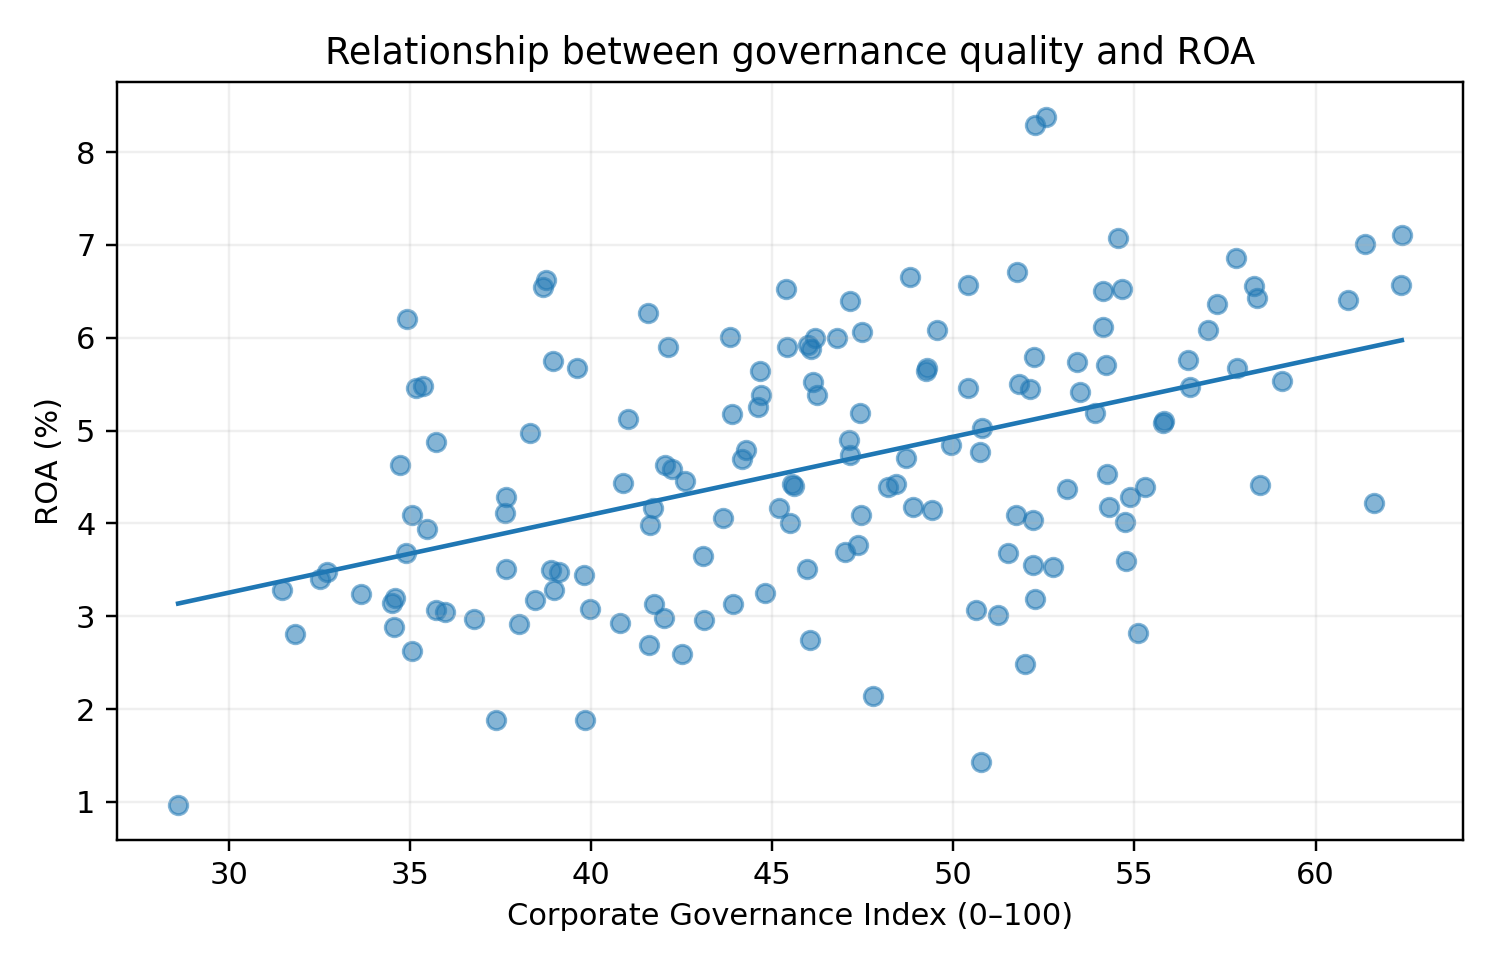
Table 6.
Correlation matrix
| Variable | CGI | ROA | TobinQ | DecisionDays | DigitalGov | RiskGov |
|---|---|---|---|---|---|---|
| CGI | 1.00 | 0.46 | 0.53 | -0.38 | 0.89 | 0.66 |
| ROA | 0.46 | 1.00 | 0.28 | -0.14 | 0.44 | 0.36 |
| TobinQ | 0.53 | 0.28 | 1.00 | -0.28 | 0.51 | 0.37 |
| DecisionDays | -0.38 | -0.14 | -0.28 | 1.00 | -0.35 | -0.27 |
| DigitalGov | 0.89 | 0.44 | 0.51 | -0.35 | 1.00 | 0.49 |
| RiskGov | 0.66 | 0.36 | 0.37 | -0.27 | 0.49 | 1.00 |
4.3. Governance maturity and economic effect
For implementation purposes, the CGI is converted into five maturity levels: Level 1 (0–39, fragmented), Level 2 (40–54, compliant), Level 3 (55–69, coordinated), Level 4 (70–84, integrated) and Level 5 (85–100, adaptive). A simple annual economic effect can be estimated as:
| (7) |
where ΔOP is the increase in operating profit, ΔFC is avoided financing and control cost, and Ci is implementation cost. For example, assume annual revenue of USD 80 million, an operating margin improvement of 0.8 percentage points, financing-cost savings of USD 180,000 and implementation cost of USD 310,000:
| (8) |
If the initial investment equals USD 420,000, the simple payback period is:
| (9) |
5. Discussion
The results support the view that governance quality is a system property rather than the sum of isolated formal mechanisms. Board independence alone does not guarantee performance; directors require timely data, clear decision rights, risk information and an incentive architecture tied to strategic outcomes. This interpretation is consistent with studies showing that the governance–performance relationship depends on the interaction of ownership, board structure and complementary control mechanisms [1, 10, 11].
The proposed M-CG framework transforms the board from a periodic approval body into an adaptive governance centre. Digital dashboards reduce information latency and improve strategic responsiveness [13], agile strategy reviews increase responsiveness, and enterprise risk management prevents speed from becoming uncontrolled risk-taking. Stakeholder mechanisms widen the board’s information base and reduce reputational and social risks [3, 12]. Flexible performance management translates governance priorities into measurable executive accountability through balanced financial and non-financial indicators [2, 7].
The positive CGI–ROA association should not be interpreted as automatic causality. Better-performing firms may invest more in governance, and unobserved management quality may affect both governance and performance. Actual applications should therefore use firm fixed effects, instrumental variables, difference-in-differences designs or regulatory shocks where suitable. Nevertheless, the scenario analysis demonstrates the full measurement and estimation logic and provides a practical template for empirical fieldwork.
The findings are consistent with the international direction of corporate-governance reform. The G20/OECD Principles increasingly connect governance with sustainability and resilience [8], the OECD methodology supports systematic assessment of implementation [9], and IFC tools emphasise progression rather than one-time compliance [5]. The M-CG model operationalises these ideas through management routines, metrics and responsibility centres.
6. Practical Recommendations
The implementation roadmap translates internationally recognized governance principles and performance-management concepts into staged organizational actions [5, 7, 8, 14].
Table 7.
Implementation roadmap for joint-stock companies
| Reform area | Recommended action |
| Board architecture | Maintain a majority or strong critical mass of independent directors; establish audit, nomination/remuneration, risk and digital-governance committees. |
| Digital governance | Introduce a secure board portal and real-time dashboard covering finance, risks, cyber incidents, ESG indicators and strategic projects. |
| Agile strategy cycle | Replace annual-only strategy control with quarterly board strategy sprints and monthly exception reporting. |
| Stakeholder governance | Approve a stakeholder materiality map and disclose how major stakeholder concerns influence board decisions. |
| Risk and internal control | Define risk appetite, link key risk indicators to strategic KPIs, and conduct annual scenario stress tests. |
| Executive incentives | Link variable remuneration to a balanced mix of ROA, cash flow, innovation, customer, employee, risk and sustainability metrics. |
| Board evaluation | Conduct annual board, committee and director evaluations, including skills, attendance, challenge quality and decision follow-through. |
| Assurance and disclosure | Obtain independent assurance over material non-financial indicators and publish a concise governance improvement plan. |
7. Conclusion
This article proposed an integrated M-CG framework for improving corporate governance in joint-stock companies. The framework combines board oversight with digital governance, agile management, stakeholder engagement, enterprise risk management and flexible performance measurement. A seven-dimensional CGI was developed and demonstrated on a reproducible scenario-based panel. The calculations show that governance maturity can be measured transparently and linked to financial, market and operational indicators. The central managerial implication is that corporate governance should move beyond formal compliance. Effective governance is an adaptive operating system that connects accountability, information, risk, incentives and stakeholder value. Joint-stock companies adopting the proposed model should implement reforms in stages, beginning with board roles and data quality, then integrating risk and performance systems, and finally progressing toward predictive and adaptive governance.
Limitations and Future Research
The empirical values are scenario-based and are not presented as audited observations from named issuers. Future research should populate the model with actual annual-report, stock-market and survey data; test alternative weighting methods such as the Analytic Hierarchy Process or entropy weighting; address endogeneity; and compare state-controlled, privately controlled and widely held joint-stock companies. Cross-country studies could also evaluate how legal enforcement and ownership concentration moderate the performance effect of modern governance models.
References